Fig.2.
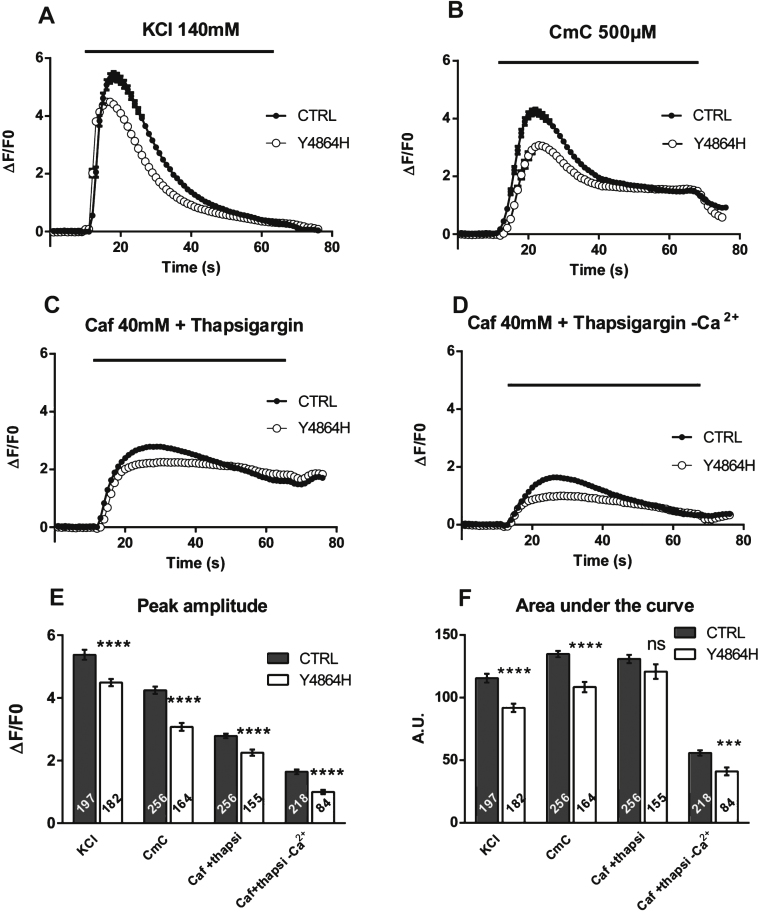
Calcium release in immortalized patient cells. Calcium imaging performed on control CTRL cells (black circle), and on patient’s Y4864H cells (white circle) differentiated for 7 to 8 days before calcium imaging. (A) Fluorescence variation curves induced by membrane depolarization (KCl 140 mM) applied during 60 s (black bar) in the presence of 2 mM external calcium, presented as mean (symbols) ± SEM. (B) Fluorescence variation curves induced by application of 4-Chloro-m-Cresol (CmC) 500 μM during 60 s (black bar) in the presence of 2 mM external calcium, presented as mean (symbols) ± SEM. (C) Fluorescence variation curves induced by application of caffeine 40 mM plus thapsigargin 1 μM (Caf+Thapsigargin) during 60 s (black bar) in the presence of 2 mM external calcium, presented as mean (symbols) ± SEM. (D) Fluorescence variation curves induced by application of caffeine 40mM plus thapsigargin 1 μM in absence of extracellular calcium (Caf+Thapsigargin - Ca2+) during 60 s (black bar) in the presence of Cd2+ and La3 +, presented as mean (symbols) ± SEM. (E) The maximal amplitude of the peak for each curve is presented in the bar plots, with the number of myotubes analyzed in each bar. ****p<0.0001, Student’s t test comparisons between CTRL and Y4864H cells, for each stimulation. (F) The area under each curve (A.U.) has been calculated for each stimulation, in control myotubes (black bars) and Y4864H myotubes (white bars) and is presented as mean ± SEM of the number of myotubes indicated in each bar. Statistics: Student’s t-test of Y4864H myotubes compared to control myotubes ****p < 0.0001, ***p < 0.001, ns: non significant.

