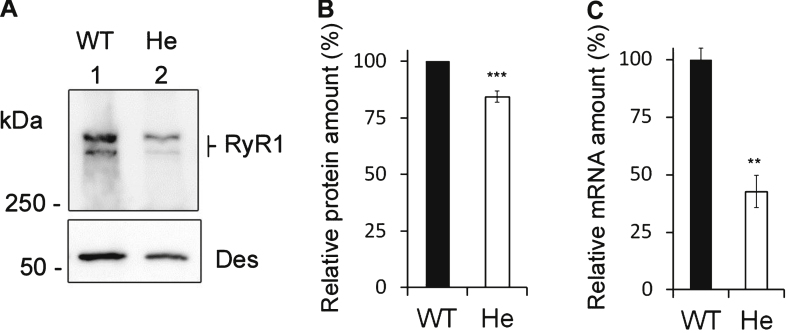
Fig.3.
Expression of RyR1 in heterozygous RyR1+/– mouse muscles. (A) Quantitative Western blot analysis of RyR1 expression in skeletal muscle homogenates from WT mice (WT) or from heterozygous RyR1+/– mice (He). (B) The relative amount of RyR1 at the protein level compared to myosin was set to 100% in WT mice. The amount of RyR1 in He mice is presented as mean ± SEM of 9 experiments performed in 3 different mice. ***p < 0.001 Student’s t-test between WT and He. (C) Q-RT-PCR analysis of levels of RyR1 mRNA expressed as a percentage of WT mice (which relative expression compared to GAPDH was set to 100%). The data are presented as mean ± SEM of 3 different mice. **p < 0.01 Student’s t-test between WT and He.

