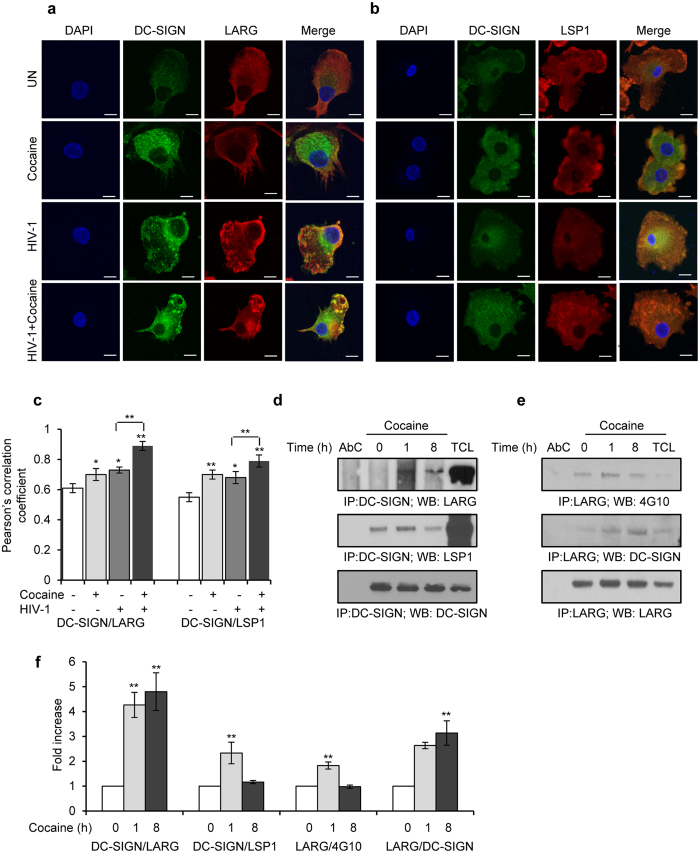
Figure 4. Cocaine enhances formation of DC-SIGN/LARG/LSP1 complex.
(a) Confocal images of DC-SIGN and LARG interaction in DCs, untreated or treated with cocaine alone, or incubated with HIV-1, or treated with cocaine and incubated with HIV for 24 hours. Scale bars = 10 μm. (b) Confocal images of DC-SIGN and LSP1 interaction in DCs, untreated or treated with cocaine alone, or incubated with HIV-1, or treated with cocaine and incubated with HIV for 24 hours. Scale bars = 10 μm. (c) Quantitative analysis of the colocalization of DC-SIGN with LARG and DC-SIGN with LSP1 in DCs, under conditions identical to (a,b), using ImageJ2 software. Data represents mean of Pearson’s correlation coefficient indices of 10 randomly chosen images per condition (*p ≤ 0.05, **p ≤ 0.01, ***p ≤ 0.001, 2-tailed t-test). (d) DCs were untreated (0) or treated with cocaine (1 μM) for indicated time points and cell lysates were immunoprecipitated with DC-SIGN antibody and subjected to Western blot analysis using LARG and LSP1 antibodies. DC-SIGN served as a loading control. (e) DCs were untreated (0) or treated with cocaine (1 μM) for indicated time points and cell lysates were immunoprecipitated with LARG antibody and subjected to Western blot analysis using DC-SIGN and 4G10 (anti-phosphotyrosine) antibodies. LARG served as a loading control. AbC = negative control; TCL = Total cell lysate. Results are representative of 3 independent experiments. (f) Quantitative analysis of the Western blots of DC-SIGN/LARG, DC-SIGN/LSP1, LARG/4G10 and LARG/DC-SIGN interactions. The band intensity in each lane was determined by Adobe Photoshop. The fold change was determined by calculating the value of each lane vs. the unstimulated control (0 h) Data represent the mean ± SD of 3 independent experiments (**p ≤ 0.01, 2-tailed t-test).

