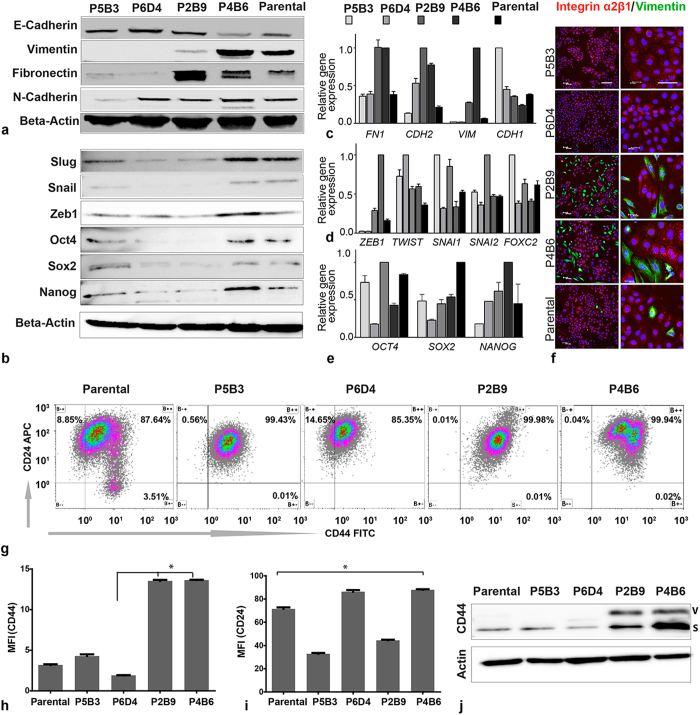
Figure 4.
(a,b) Representative Western blot images of selected EMT and cancer stem cell associated marker expression by clones P5B3, P6D4, P2B9, P4B6 and parental OPCT-1 (n = 5). Beta-actin was used as a loading control in each set of the experiments. (c) Relative gene expression of common EMT associated marker genes fibronectin, E-cadherin, vimentin and N-cadherin (n = 3). (d) Quantitative gene expression analysis of common EMT transcription factors ZEB1, TWIST, SNAI1, SNAI2 and FOXC2. (e) Quantitative gene expression analysis of embryonic stem cell genes NANOG, OCT4 and SOX2. Real-time PCR values were normalised to the housekeeping gene HPRT (n = 3), expression of each gene was normalised to its highest expressing sample among the five genotypes studied. Each bar represents the mean of three independent experiments and the error bars represent the standard deviation. (f) Dual immunofluorescence staining of vimentin (green) and integrin α2β1 (red) in parental and all clonal progenies at two magnifications 10× (left column) and 20× (right column). Scale bar: 50 μM. (g) Dot plot showing the flow cytometry surface staining of CD44 and CD24 molecules on parental and clonal progenies of OPCT-1. (h) Staining intensity of CD44 assessed by mean fluorescence (n = 4). (i) Staining intensity of CD24 assessed by mean fluorescence (n = 4). (j) Western blot image showing expression of CD44 v & s variants. Unprocessed original scans of the blots are shown in Supplementary Figure 9.

