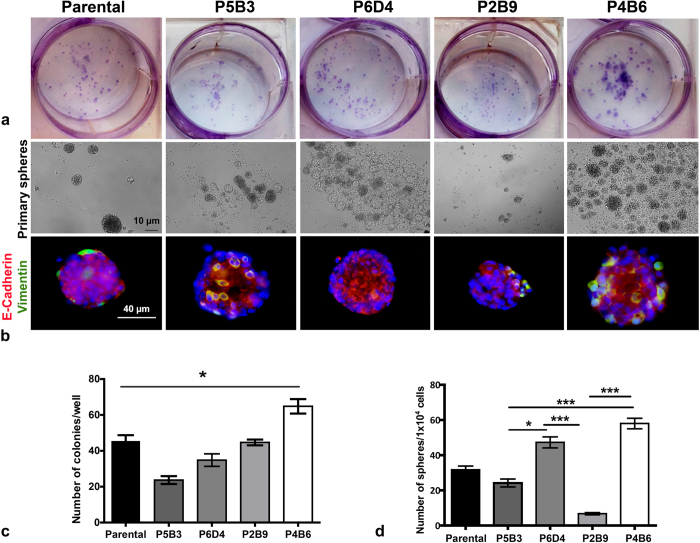
Figure 5. Assessment of stem cell characteristics of OPCT-1 clonal progenies.
(a) Representative images of the colonies. Cells were plated at clonal density, cultured for a period of 10 days, fixed with ethanol and stained with crystal violet prior to enumerating the colonies. (b) Representative bright field and immunofluorescence images from the sphere-forming assay performed on clones P5B3, P6D4, P2B9, P4B6 and parental OPCT-1. Cells were plated in ultra-low adherent 24-well plates at clonal density in normal medium, and cultured over a period of 12 days (n = 3). Scale bar: 50 μM. (c) Bar graph showing the number of colonies obtained from parental and each of the OPCT-1 clones, each bar represent the mean ± SEM. Significant differences were calculated by the nonparametric Friedman test. (p = 0.0003, Friedman Statistic < 21.01, df = 4). (d) Bar graph showing number of primary sphere-formation., each bar represents the mean of three assays and the error bars represent the SEM. Significant differences were calculated by the non-parametric Kruskal-Wallis test. (p = 0.0001, Kruskal-Wallis statistic < 54.60, df = 4), Dunn’s multiple comparison test was used for pairwise comparisons. the number of cells seeded in each assay is indicated on the Y axis.

