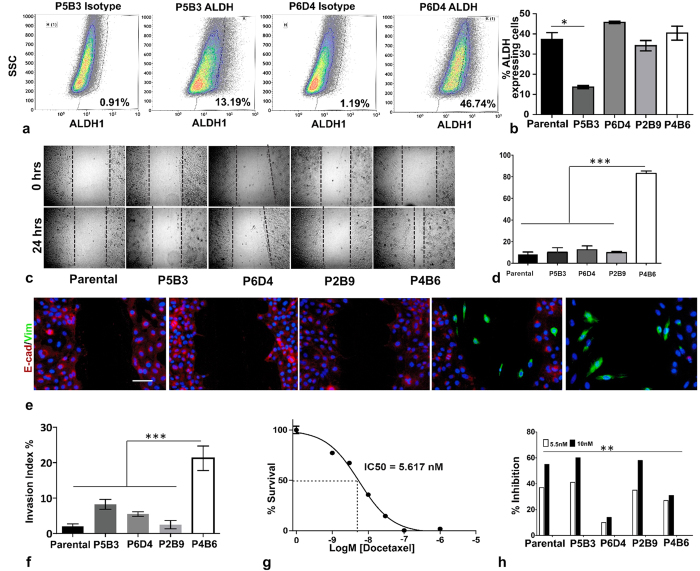
Figure 6.
(a) The results of the Aldefluor assay, with representative flow cytometric data from which the percentage of ALDH1hi cells present in each of the clones and parental OPCT-1 was determined. Representative data showing the least and the most ALDH1 activity as a density dot-plot. Side scatter is represented on the Y-axis and ALDH1 staining is represented on the X-axis. Representative isotype control staining is also given (n = 3). (b) Percentge of ALDH1 high cells in parental and clonal progenies of OPCT-1. Data presented as median ± interquartile range. Significant differences were calculated by the nonparametric Kruskal-Wallis test (p = 0.0244, Kruskal-Wallis statistic = 12.89, df = 4 n = 4). (c) Representative images from the in vitro scratch assay showing wound closure after 24 h of wounding. (d) Percentage of wound closure after 24 h represented as bar graph. (e) Dual immunofluorescent staining was used to determine the phenotype of migratory cells, E-cadherin (red) and vimentin (green). Scale bar: 50 μM. (f) Results of the Matrigel invasion assay. Data are presented as the median ± interquartile range. Significant differences were calculated by the nonparametric Friedman test. (p = 0.0024, Friedman statistic = 18.49 n = 3). (g) Dose response curve of parental OPCT-1 cell line to docetaxel measured using the thymidine proliferation assay. The cell line was treated with a range of concentrations of docetaxel to reveal a dose-dependent growth response. The IC50 concentration of the drug was calculated using GraphPad Prism software (n = 3). The y-axis represents the normalised drug response, the x-axis represents the drug concentration used in Log molar scale. The calculated IC50 (5.62 nM) is given on the graph. (h) Bar graph demonstrating the proliferation of the OPCT-1 clones and parental OPCT-1 treated with control media, the docetaxel IC50 dose (5.5 nM) and double the docetaxel IC50 dose (11 nM) of parental OPCT-1, assessed using the thymidine proliferation assay. Data were analysed by means of a Factorial ANOVA using STATSTICA software (p = 0.014715, F < 2.318, n = 5).

