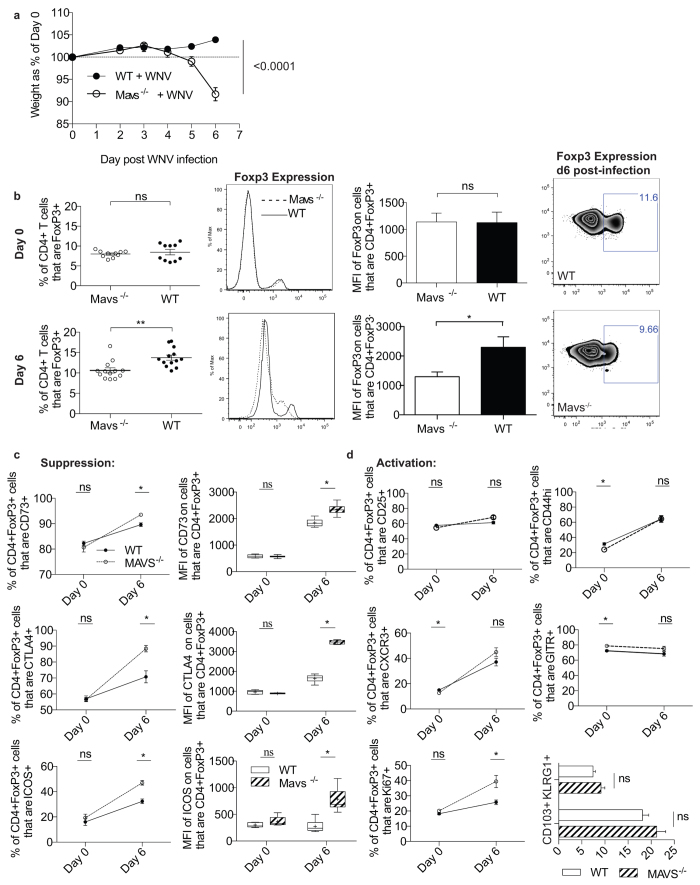
Figure 1. Foxp3 expression is down-regulated in Mavs−/− mice after WNV infection.
(a) Weight loss of WT and Mavs−/− mice was assessed following s.c. footpad infection with 1000 PFU WNV. (b) Foxp3 expression in splenic lymphocytes was assessed through flow cytometry in both naïve (Day 0) and WNV infected (Day 6) Mavs−/− mice and compared to age matched WT controls. After per cell analysis of Foxp3 expression through median fluorescence intensity (MFI), we find that the Treg frequency difference is due to down-regulation of Foxp3 expression. (c) Treg suppressive molecule expression was examined by flow cytometry following 6d of WNV infection. (d) Activation of Tregs after infection in KO and WT controls. Data represents 2 independent experiments (D0 n = 10 WT/KO), (D6 n = 13 WT/KO). Statistical significance calculated using two-tailed unpaired Student’s t tests, with * indicating p < 05. Error bars reflect +/− SEM. Whisker box plots display min and max values; +indicates mean value.

