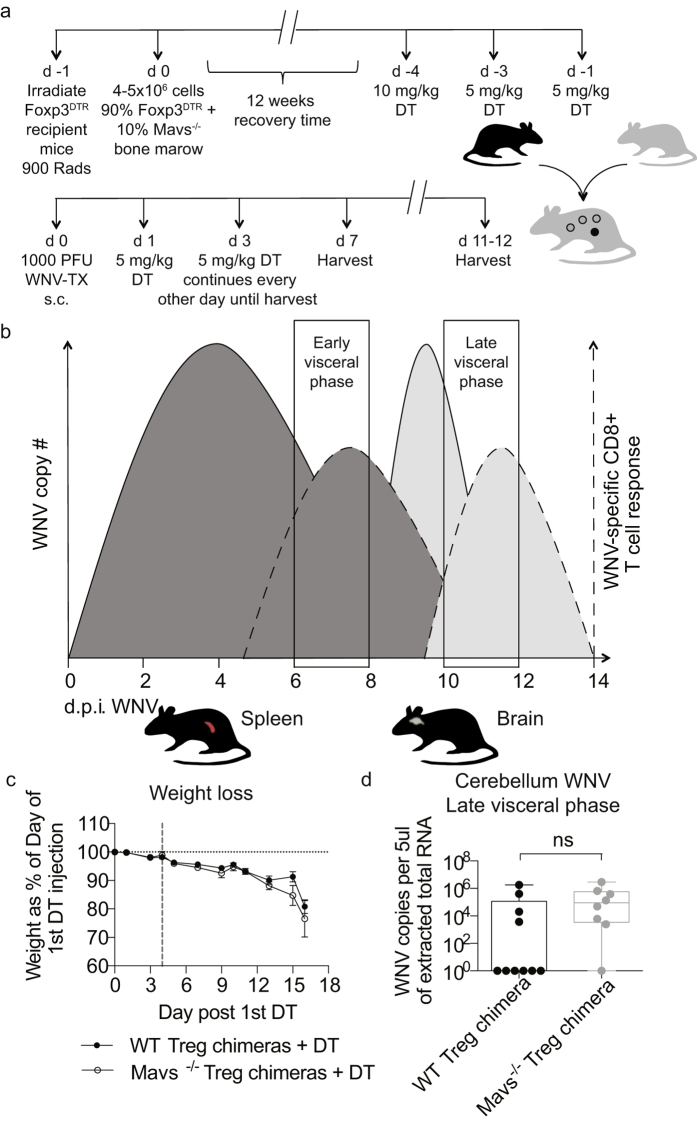
Figure 4. Treg-intrinsic MAVS does not play a role in disease outcome to WNV in vivo.
(a) Schematic shows BM chimera generation and diphtheria toxin (DT) and WNV infection schedule. One day after irradiation, congenically marked Foxp3DTR recipient mice received 90% Foxp3DTR + 10% Mavs−/− or WT bone marrow cells and allowed to recover for 12 weeks. DT was administered every other day until day 4 in order to ablate DTR expressing Tregs and allow Mavs−/− or WT Tregs to expand and fill the niche. Mixed bone marrow chimeric mice were then infected s.c. with 1000 PFU WNV in the footpad to mimic natural infection. Mice were monitored for morbidity and mortality for up to 12 days post infection and then spleens and brains harvested. Tissues were analyzed for effector cell frequencies, counts and phenotype using flow cytometry. (b) WNV pathogenesis has been described as proceeding through three distinct phases: the Early phase during which WNV replicates within primarily infected skin tissue and migrates to the draining lymph nodes, the Visceral-organ dissemination phase (VOD phase) and the CNS phase45. Our work focuses on the resolution of the VOD phase and the potential impact of MAVS signaling in Tregs during this phase, by examining early VOD and late VOD events in WNV pathogenesis in subcutaneously infected mice. (c) Mice were monitored for weight loss through the infection course. Vertical dashed line indicates date of infection. There were no statistically significant differences found between groups. Statistical significance calculated using two-tailed unpaired Student’s t tests. Error bars reflect +/− SEM. (d) WNV infected mice were perfused with PBS and cerebellums collected from the brains of WT (n = 10) and Mavs−/− (n = 8) chimeras on day 11–12 post infection. RNA was extracted and quantified using qRT-rtPCR. Whisker plots show min and max values. There were no statistically significant differences found between both groups. Statistical significance was calculated using two-tailed unpaired Student’s t tests.

