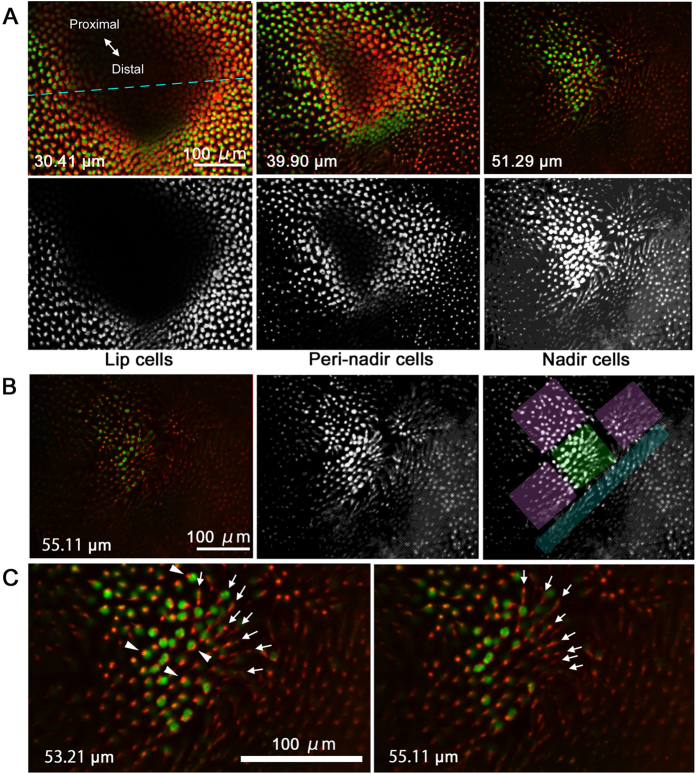
Figure 3. Detailed images of the focal indentation.
Depth of the horizontal section is shown in each panel as in Fig. 2. (A) Three types of cells were identified based on their locations in the indentation: lip cells, peri-nadir cells, and nadir cells. The top three panels are identical to those in Fig. 2. The three bottom panels are half-tone sketches from the top panels. The broken blue line indicates the position of the vertical section shown in Fig. 2B. (B) Deepest nadir cells at the bottom of the focal indentation. The original image (left) was converted to half-tone sketches (middle and right). Possible cellular clusters are indicated in green (nadir cells), pink (peri-nadir cells), and blue (peri-nadir cells). (C) High magnification of the nadir cells. Red mitochondrial signals signify the possible horizontal processes. Directions of the horizontal processes are indicated by arrows. See also Supplementary Video 2 for comparison.

