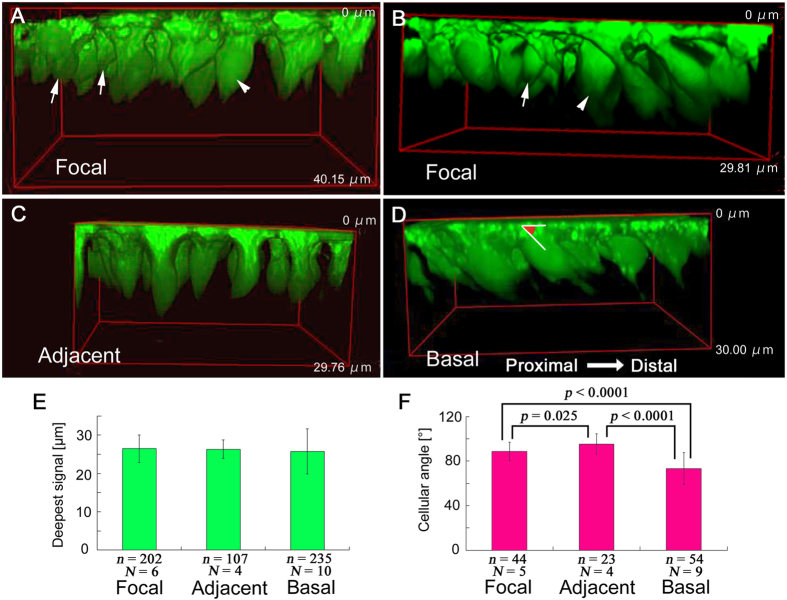
Figure 5. Three-dimensional reconstruction of wing epithelial cells stained with CFSE for cytoplasm.
Vertical length of the 3D cuboid is shown in each panel. (A,B) Focal region. Relatively small cells (arrows) and relatively large cells (arrowheads) are indicated. (C) Adjacent region. Cells are relatively homogeneous. (D) Basal region. Cells are relatively homogeneous. An example of the measured cellular angle is indicated. (E) Deepest CFSE fluorescent signal from the apical surface. Shown are mean values ± standard deviation. The number of cells examined (n) and the number of pupae used (N) are indicated. (F) Cellular angle. Shown are mean values ± standard deviation. The number of cells examined (n) and the number of pupae used (N) are indicated.

