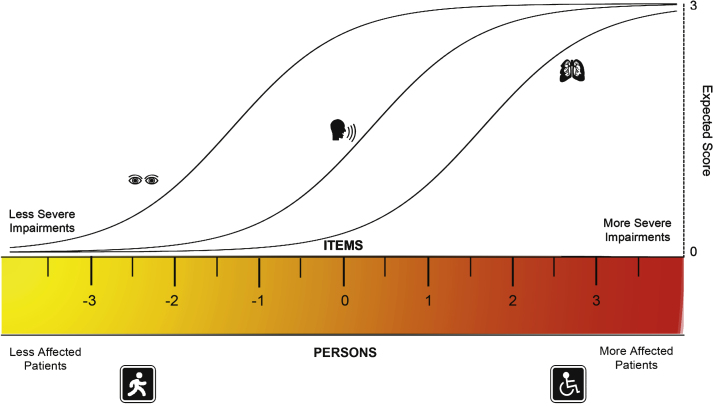
Fig.1.
The rasch model. In this figure, the ruler represents a continuum of the trait being measured, in this example disease severity expressed through impairments. By definition the ruler is centered at 0 logits and both the persons and the items are aligned in this metric. With higher severity, more affected persons are located towards the right. The items should follow a hierarchy, were items representing less impairments are closer to the left and severe impairments closer to the right. For each item there is a characteristic curve for their expected scores. As severity increases, the probability of having a higher score in each item increases. Therefore, the probability of achieving a given score on a specific item depends on the persons’ location on the severity scale being related to the severity of the item of interest. When all the assumptions of the Rasch model are met, the scores on the logit scale are considered to be at the interval level, where one unit is the same acrossthe continuum.

