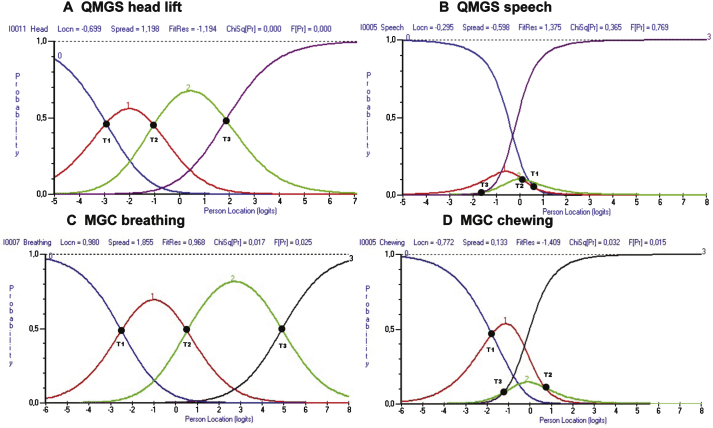
Fig.3.
Example of ordered and disordered thresholds for the QMGS and the MGC. Figs. 2A and 2C demonstrate ordered thresholds (T1 < T2 < T3) for items of the QMGS and MGC respectively. In Figs. 2B and 2C, the thresholds don’t follow the expected order. This suggests that either the physicians are not good at discriminating between responses (e.g. QMGS speech item), or that the patients cannot discriminate between response options (e.g. MGC chewing item). T1 = Thresholds between scores 0 and 1. T2 = Thresholds between scores 1 and 2. T3 = Threshold between scores 2 and 3.

