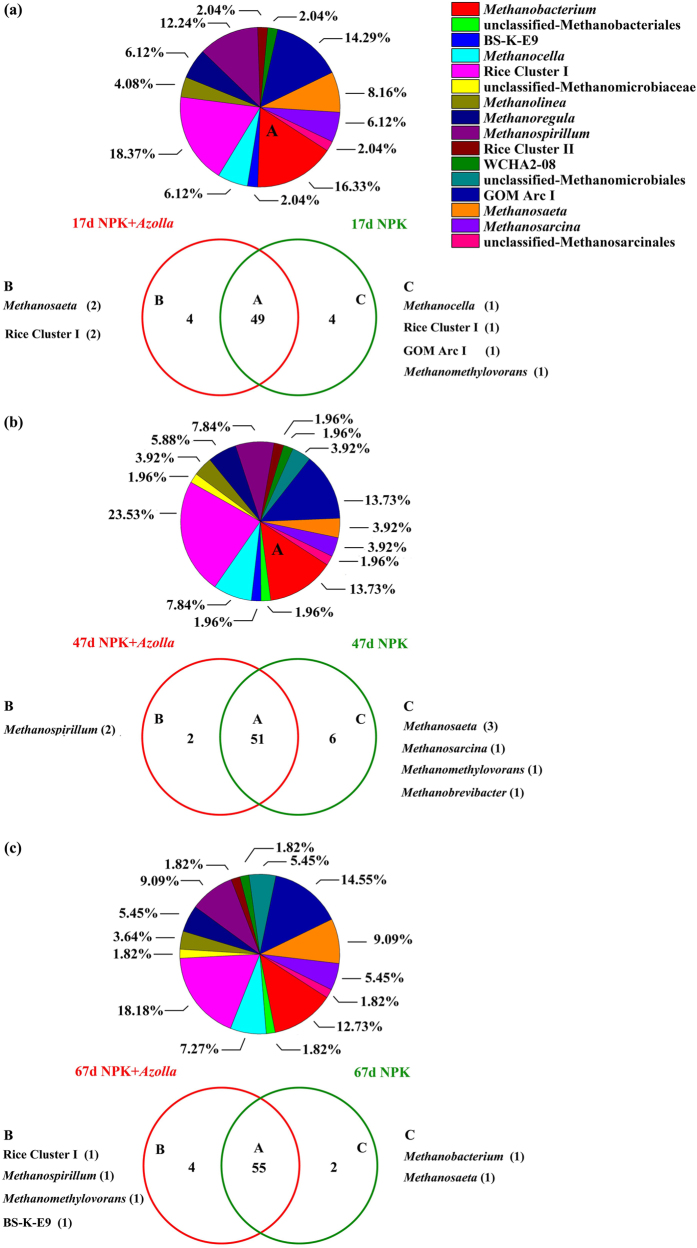
Figure 6.
Venn diagrams and pie charts showing the distribution of methanogenic archaeal 16S rRNA OTUs in the two treatments across three sampling times: day 17 (a), day 47 (b) and day 67 (c) after rice transplantation. The numbers within the diagrams indicate the number of OTUs shared between two treatments (A) or unique to the given treatment (B,C) (unique OTUs were identified as unique that were found in all three replicates of one treatment but not in any of the triplicates of the other treatment). The pie charts denote the taxonomic identity and distribution of shared OTUs (A). Unique OTUs are listed beside the Venn diagrams (B,C). NPK, rice cropping without dual cropping of Azolla under recommended fertilization; NPK + Azolla, rice cropping with dual cropping of Azolla under recommended fertilization.

