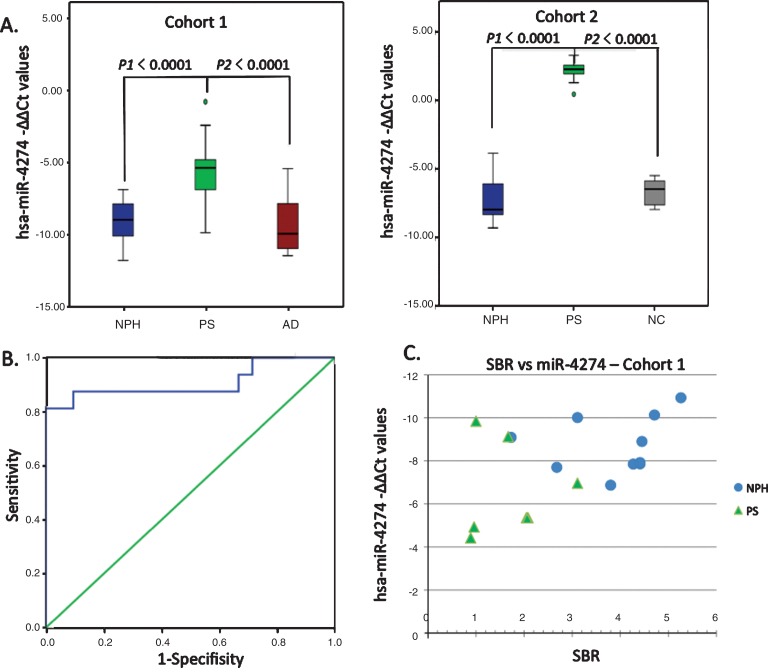
Fig.2.
Graphical analysis comparing candidate miRNAs. A) Comparison of hsa-miR-4274 –ΔΔCt values between the various groups in the 2 individual cohorts. Box and whisker plot of hsa-miR-4274 expression in CSF samples of definite iNPH (NPH), possible iNPH with parkinsonian spectrum (PS), possible iNPH with Alzheimer’s disease (AD), and non-affected elderly individuals (NC). y-axis: –ΔΔCt values; x-axis: studied groups. Boxes: interquartile range, central line is the median. Whiskers: upper and lower adjacent values. Dots: outlier values. B) Receiver operating characteristic (ROC) analysis of the hsa-miR-4274 in iNPH group compared with the PS group. x-axis shows specificity values. y-axis shows sensitivity values. C) The correlation of hsa-miR-4274 expression with the specific binding ratio (SBR) of the dopamine transporter scan (DaTScan). hsa-miR-4274 –ΔΔCt values are plotted against SBR. iNPH patients (blue circles). PS patients (green triangles). hsa-miR-4274 levels are correlated with SBR (r = –0.493, p = 0.044; Spearman’s correlation.)

