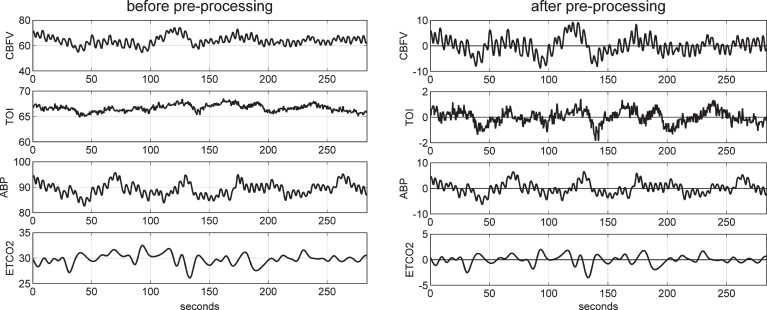
Fig.1.
Illustrative time-series data over about 5 min for one control subject, representing beat-to-beat spontaneous variations of CBFV (top panel), TOI (2nd panel), ABP (3rd panel), and ETCO2 (bottom panel) before (left column) and after (right column) pre-processing. The units are: cm/s for CBFV, % for TOI, and mmHg for ABP and ETCO2.

