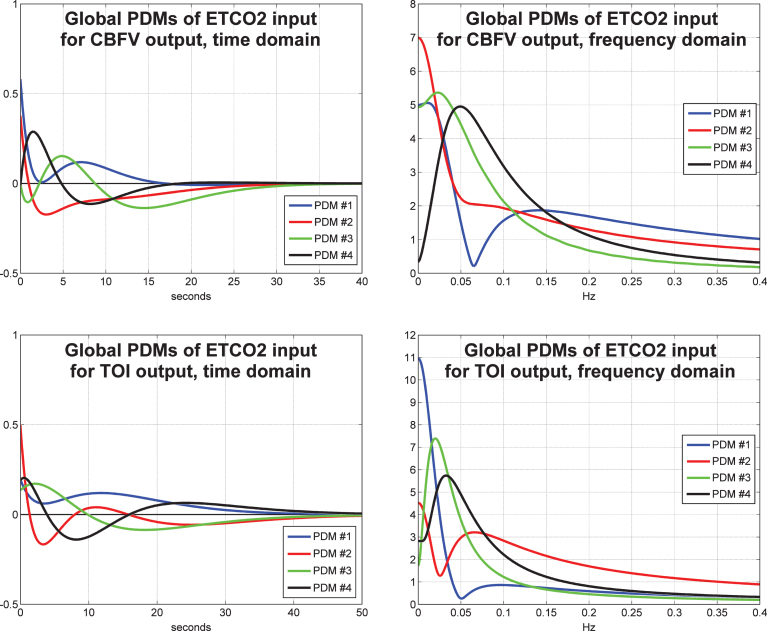
Fig.4.
The four global PDMs for the ETCO2 input obtained from the data of 20 control subjects (10 male and 10 female) for the CBFV output measured via TCD (top) and from the data of 22 control subjects (11 male and 11 female) for the TOI output measured via NIRS (bottom) in the time-domain (left) and frequency-domain (right).

