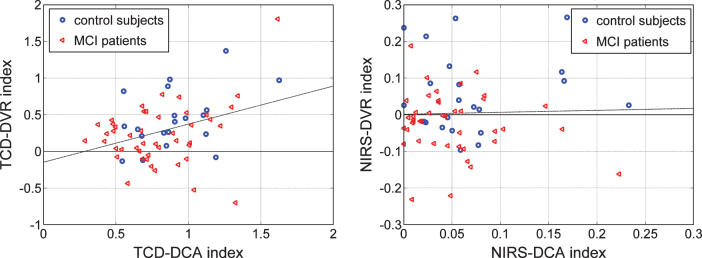
Fig.10.
Scatter-plots of TCD-DCA versus TCD-DVR indices (left) and NIRS-DCA versus NIRS-DVR indices (right) for all controls (blue circles) and patients (red triangles) in each type of output recording. The regression lines correspond to correlation coefficients of 0.361 (p = 0.0028) and 0.028 (p = 0.8239) for the TCD and NIRS indices, respectively.

