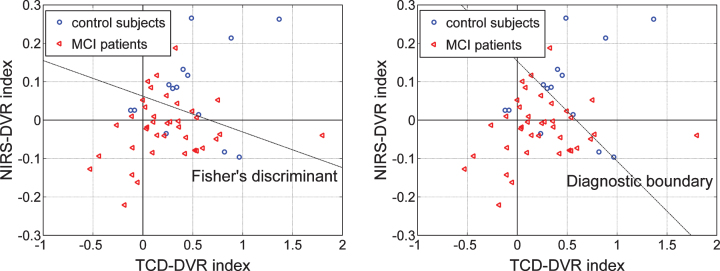
Fig.11.
Scatter-plots of TCD-DVR versus NIRS-DVR indices for 14 controls (blue circles) and 38 patients (red triangle) who have both types of output recordings. The dashed line in each plot indicates a possible separation line between the two groups (Fisher’s Linear Discriminant in the left panel, and “diagnostic boundary” in the right panel determined by optimization algorithm) that corresponds to a composite index with p-value smaller than the separate p-values of each index shown in Tables 6 and 7—specifically, p = 0.0044 for Fisher’s Discriminant and p = 0.0049 for the “diagnostic boundary. The latter has a slightly higher p-value but yields better classification/diagnostic results.

