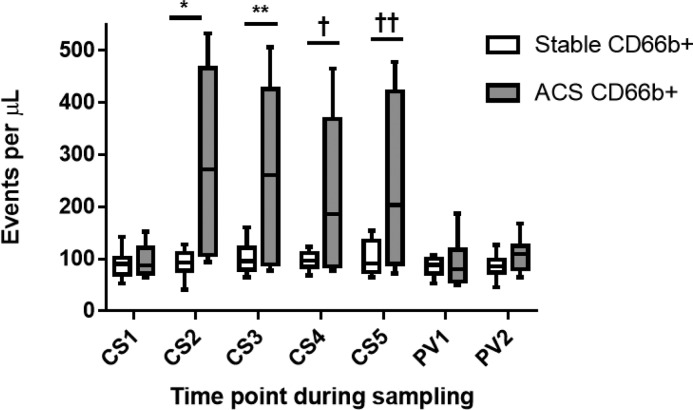
Figure 3. CD66b+ MP release after PCI in SAP and ACS patients.
CS and peripheral vein (PV) samples were drawn from SAP (n=8) and ACS patients (n=8) pre- and post-PCI. Results as median, 25th and 75th percentiles and minimum and maximum error bars. CS1 and PV1–pre-intervention, CS2-5 and PV2 post-intervention as described in Figure 1. *CS2 SAP compared with CS2 ACS; P=0.009, **CS3 SAP compared with CS3 ACS; P=0.02, †CS4 SAP compared with CS4 ACS; P=0.03, ††CS5 SAP compared with CS5 ACS; P=0.03.

