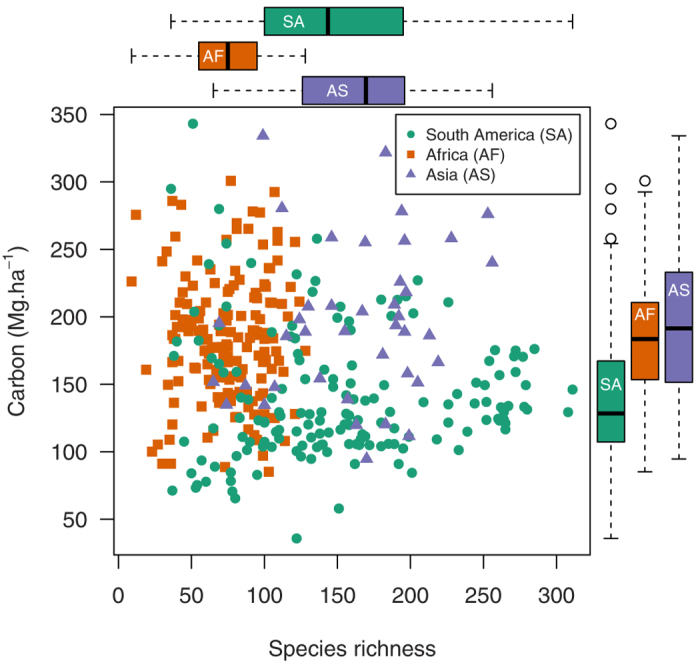
Figure 1. No relationship across the tropical forest biome between carbon stocks per unit area and tree species richness.

Green circles = plots in South America (n = 158), orange squares = Africa (n = 162) and purple triangles = Asia (n = 40). Boxplots show variation in species richness and biomass carbon stocks in each continent. Both carbon and species richness differed significantly between continents (Table 2), but no significant correlation exists between carbon and species richness, neither within each continent (τ ≤ 0.132, P ≥ 0.12), nor across all three (linear regression weighted by sampling density in each continent, β < −0.001, t = 0.843, P = 0.4, weights = 1.2 for South America, 0.6 for Africa and 1.8 for Asia). Results for other diversity metrics are similar (Supplementary Fig. S13).
