
Figure 2. Decay in similarity (Sørensen index) of tree communities with distance in South America (green), Africa (orange) and Asia (purple).
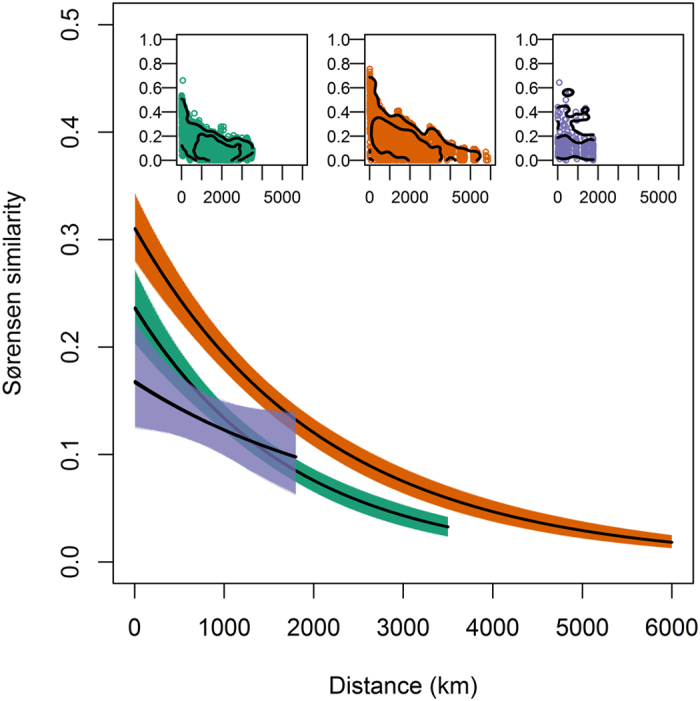
Solid lines show fitted relationships of the form ln(similarity) = α + β × distance + ε. Estimated α and β parameters for each continent are given in Supplementary Fig. S12, ε denotes binomial errors. Differences in the α parameter indicate differences in the similarity of neighbouring stands, while differences in the β parameter indicate differences in the distance decay of tree community similarity. Filled polygons show 95% confidence intervals derived from 10000 bootstrap resamples. Data underlying these relationships are shown in insets, with contours (0.05 and 0.25 quantiles) overlain to show the density of points following kernel smoothing.