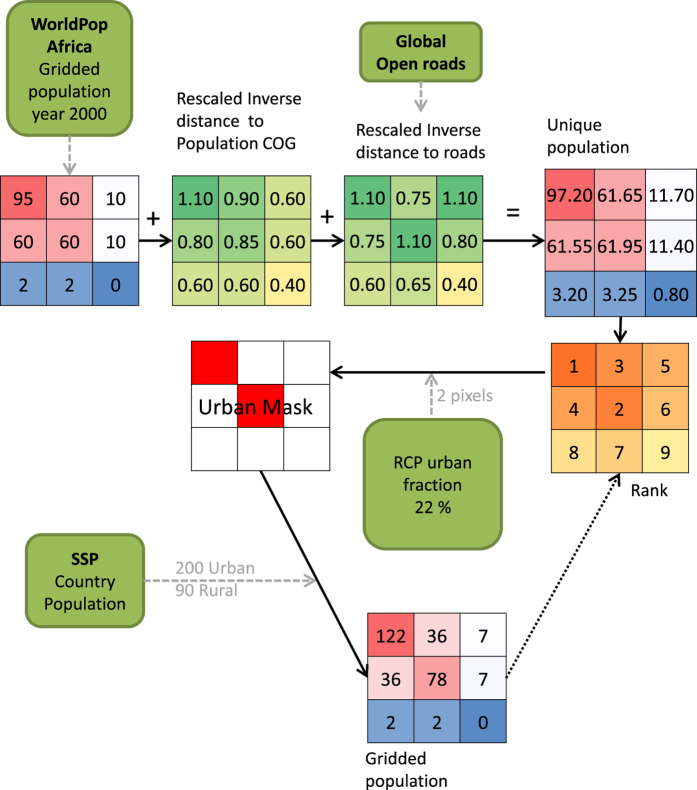
Figure 1. Flowchart and example of the method used to distribute the population.
Example made with artificial numbers for visualization purposes. For simplicity the smaller grid cells each corresponds to one 30 arc second pixel and the full grid (9×9) represent one urban fraction grid cell (0.5 degree) and the full grid 9x9 corresponds to one country. The example highlights the need to add inverse distance to population center of gravity (COG) and inverse distance to roads to the population data to be able to uniquely rank the pixels. The country SSP population is distributed for rural and urban separately based on the urban mask and the gridded population from the year before or unique population for the first year. The green boxes with rounded corners indicate input data. Inverse distance to center of gravity and inverse distance to roads are for the small example not rescaled to the same range as done when processing the dataset.

