
Figure 6. BRET analysis of coiled-coil complex formation.
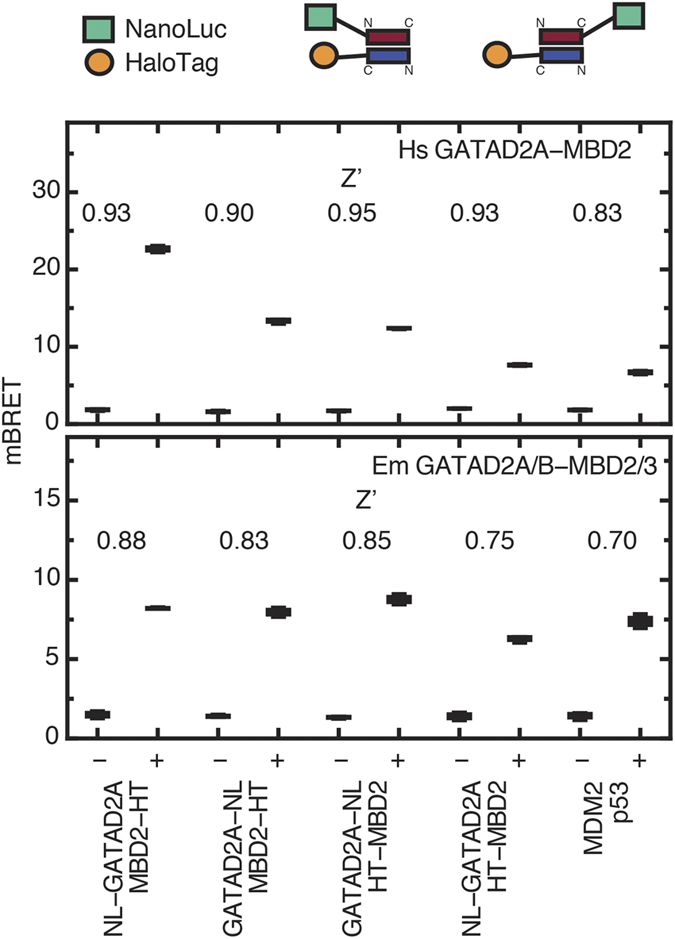
Measured BRET ratios are shown in boxplots for different donor and acceptor combinations of Hs (upper panel) and Em (lower panel) coiled-coil domains as well as the MDM2:p53 positive control. Each experiment was performed in triplicate with (+) and without (−) addition of the NanoBRET™ 618 fluorescent ligand and Z’ calculated and shown for each.