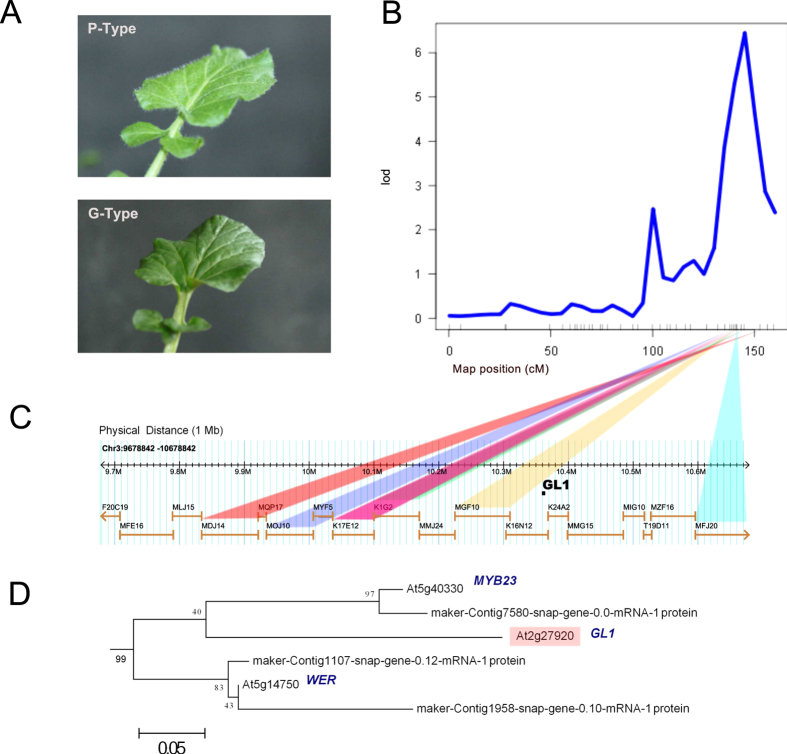
Figure 1. Differentiation in trichomes between P and G-type.
(A) Phenotypic difference in trichome density between P and G type plants, (B) QTL on linkage group eight accounting for 29.8% of the phenotypic variation for trichome density, (C) comparative genomic analysis around the QTL region based on sequence homology between B. vulgaris scaffolds and A. thaliana BAC sequences, and (D) molecular phylogenetic analysis by the Maximum-Likelihood method using the JTT matrix-based model. The tree with the highest log likelihood is shown. Bootstrap values are shown next to the branches. The tree is mid-point rooted, drawn to scale, with branch lengths proportional to the number of substitutions per site. We used genes from the orthologus group containing the A. thaliana GL1, and genes from a BLASTP search using a coverage cutoff of 80% and a minimum identity threshold of 50%. The sub-clade containing GL1 is shown.

