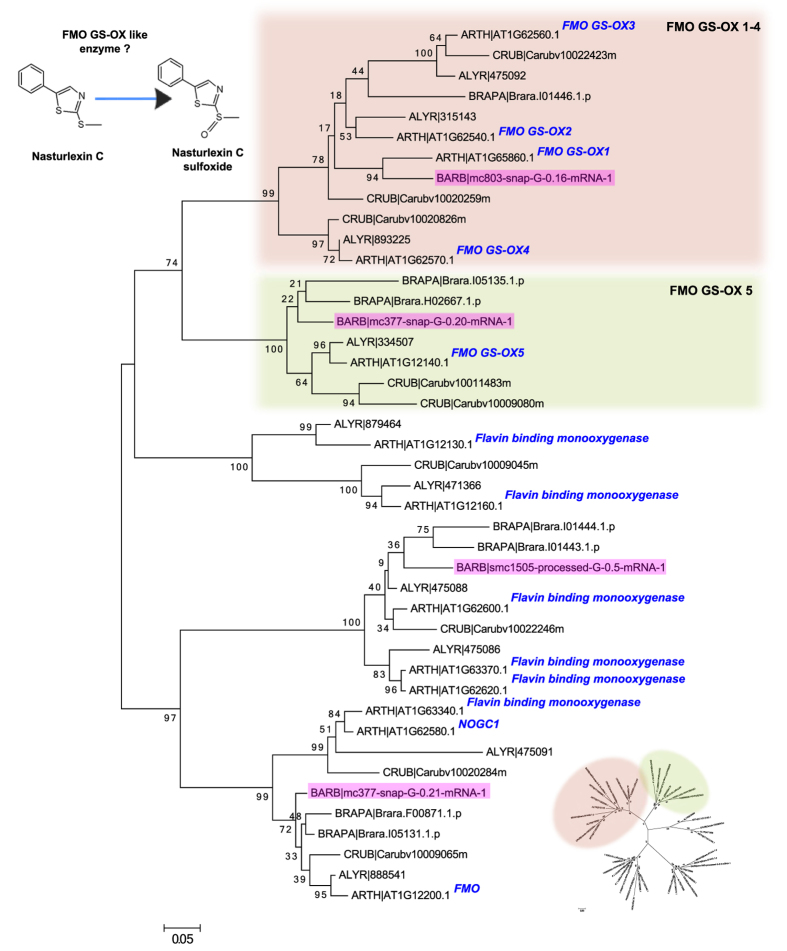
Figure 3. Phylogenetic analysis of FMO GS-OX proteins.
Molecular phylogenetic analysis by the Maximum-Likelihood method using the JTT matrix-based model. The tree with the highest log likelihood is shown. Bootstrap values are shown next to the branches. The tree is mid-point rooted, drawn to scale, with branch lengths proportional to the number of substitutions per site. We analysed proteins from the orthologous group containing the A. thaliana FMO GS-OX proteins. B. vulgaris proteins are highlighted in blue, and A. thaliana proteins are labeled. Radial tree clearly showing the five distinct branches is shown in the bottom right. A suggested enzymatic function of one or more of the B. vulgaris FMO GS-OX proteins is indicated (top left).

