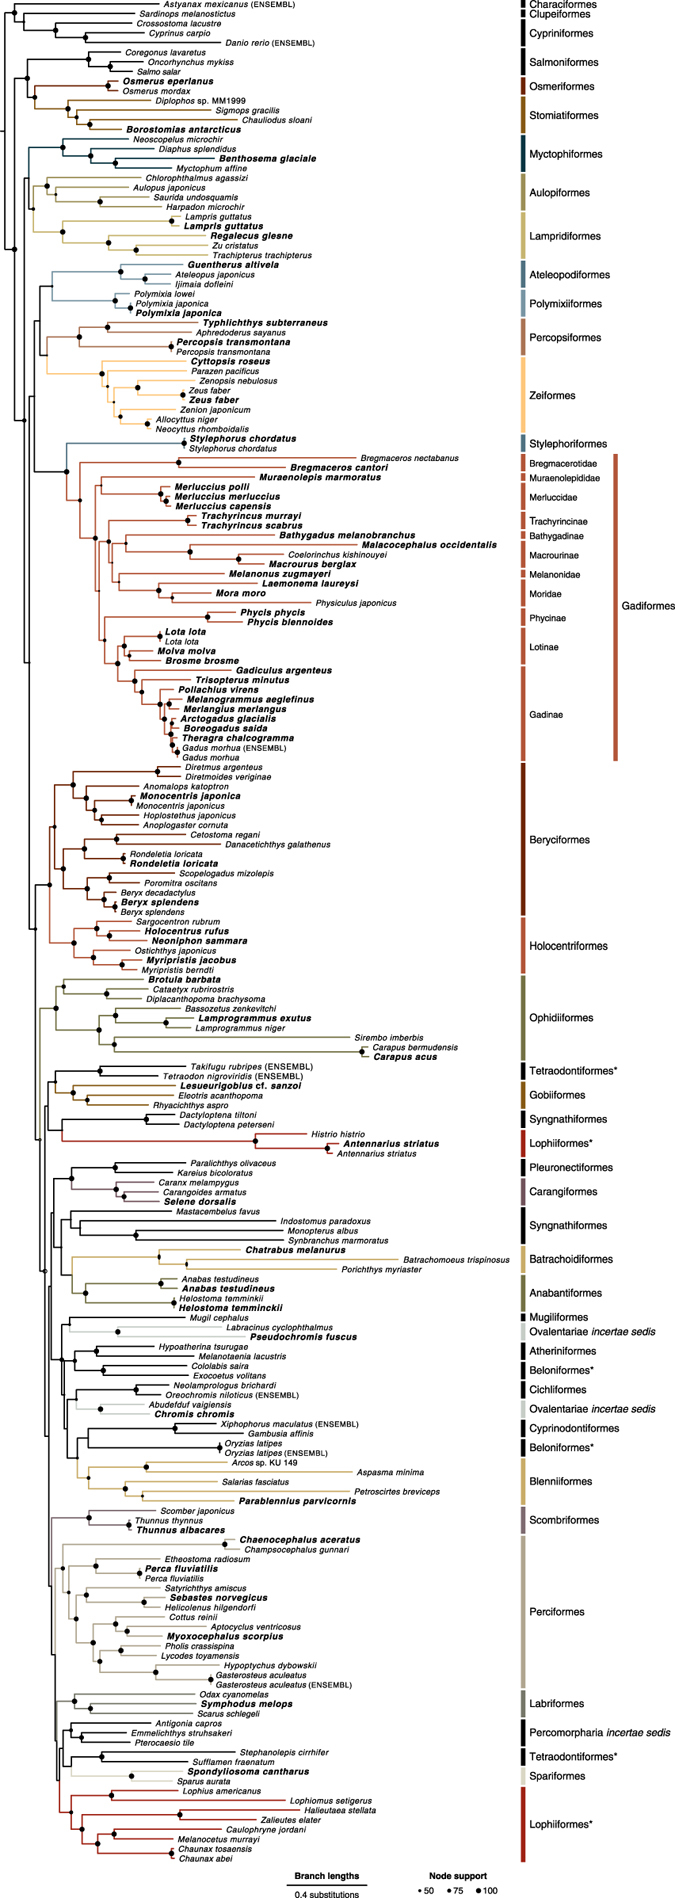
Figure 3. Maximum-likelihood phylogeny of teleost mitochondrial genome sequences.

Sequences extracted from the new assemblies are marked in bold, all other mitochondrial genome sequences were previously available from the GenBank or ENSEMBL (where noted) databases. Black circles on nodes are sized proportional to bootstrap support, and the circle size corresponding to support values of 50, 75, and 100 are shown. Clade labels indicate taxonomic orders of all species as well as (with smaller font size) the (sub)family of gadiform species, following Betancur-R. et al.10 and Nelson48. Note that the orders Tetraodontiformes, Beloniformes, and Lophiiformes appear as non-monophyletic (marked with asterisks). For comparability, color code is identical to Fig. 1 in Malmstrøm et al.11. The tree file in Newick format has been deposited on Figshare under DOI: doi:10.6084/m9.figshare.4224234 (Data Citation 4).
