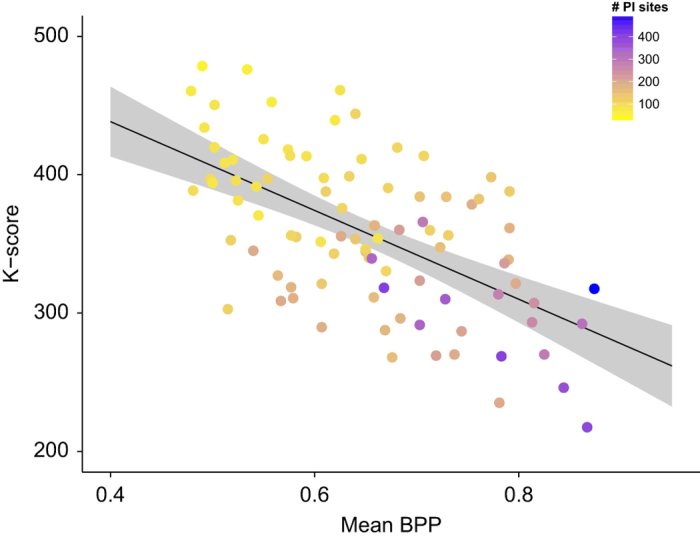
Figure 4. Distances between tree topologies compared to phylogenetic signal.

Topological distances are measured by the K-score between the gene trees and the species trees, and phylogenetic signal of the gene trees is measured as mean Bayesian posterior probability (BPP). Dots are colored according to the number of parsimonious-informative (PI) sites. The black line represents the linear regression (R2=0.34, P<10–15).
