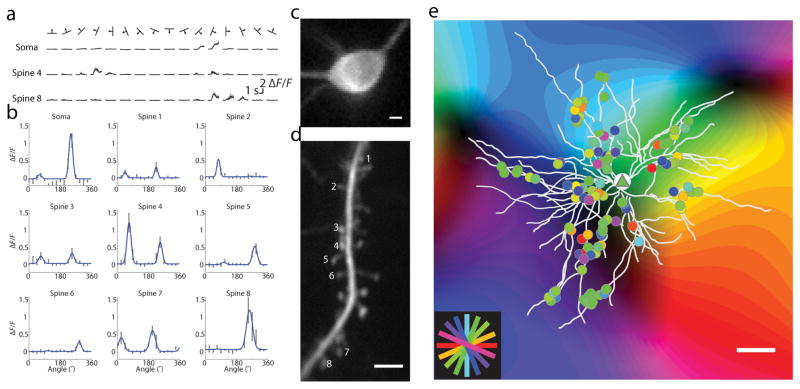
Figure 1. Response properties of orientation-selective synaptic inputs to neurons in the ferret visual cortex.
(a) Average somatic and spine responses to visual stimuli, mean is black and SEM is grey; (b) Example orientation tuning curves, black bars: mean ± SEM, blue lines: fits; (c) Nuclear-excluded soma, scale bar 5 μm; (d) Dendritic segment with spines whose tuning curves are depicted in (b); scale bar 5 μm; (e) Single neuron (triangle) with all serially imaged orientation-selective spines (circles) overlaid on intrinsic signal map and colored by orientation preference; scale bar 50 μm;

