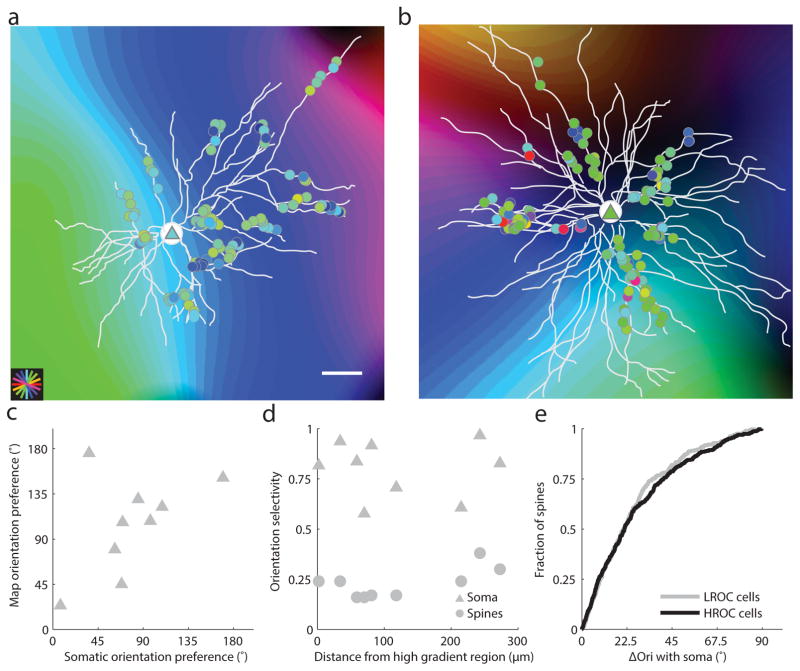
Figure 3. Location in orientation preference map reliably predicts somatic orientation preference but not somatic or synaptic input selectivity.
(a–b) Dendritic spine (circles) and somatic (triangles) orientation preference overlaid onto orientation preference map in low and high rate of change areas; scale bar is 50 microns; (c) Somatic orientation preference is strongly correlated with the underlying intrinsic signal map; (d) Distance from high gradient region does not reliably predict somatic (triangles) or summed spine (circles) orientation selectivity; (e) The distribution of spine orientation preference relative to somatic orientation preference is not significantly different between cells in low rate of change regions versus cells in high rate of change regions.

