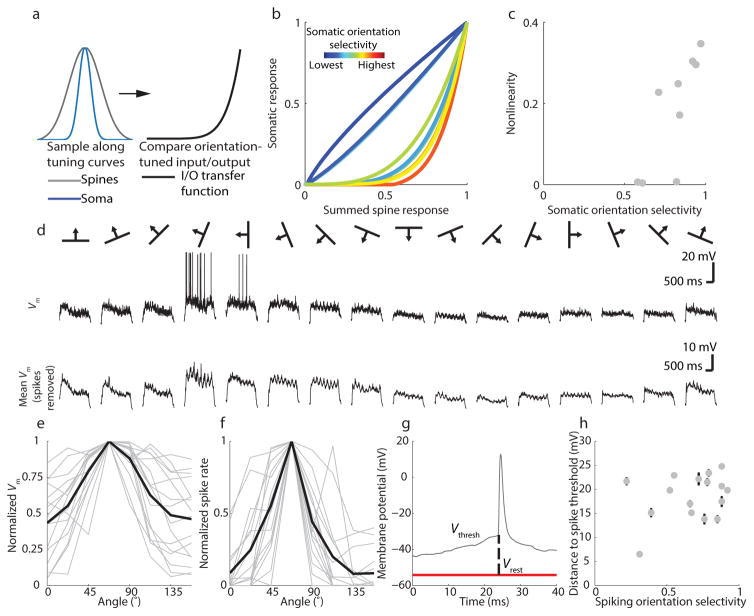
Figure 4. Nonlinear synaptic integration in visual cortical neurons.
(a) Generation of input/output transfer function; (b) Input/output transfer functions for all cells, colored by orientation selectivity; (c) Somatic orientation selectivity is correlated with nonlinearity in the input/output functions; (d) top: single trial membrane potential with spikes included; bottom: average membrane potential after removing spikes; (e–f) Vm and spiking tuning curves for whole-cell recordings peak-aligned to 67.5 degrees; grey lines are individual neurons and black lines are population average; (g) distance to threshold was measured as distance from resting potential to the kink in the AP waveform for 10 spikes per neuron; (h) distance to threshold is not correlated with spiking orientation selectivity, error bars are +−SEM

