Figure 6.
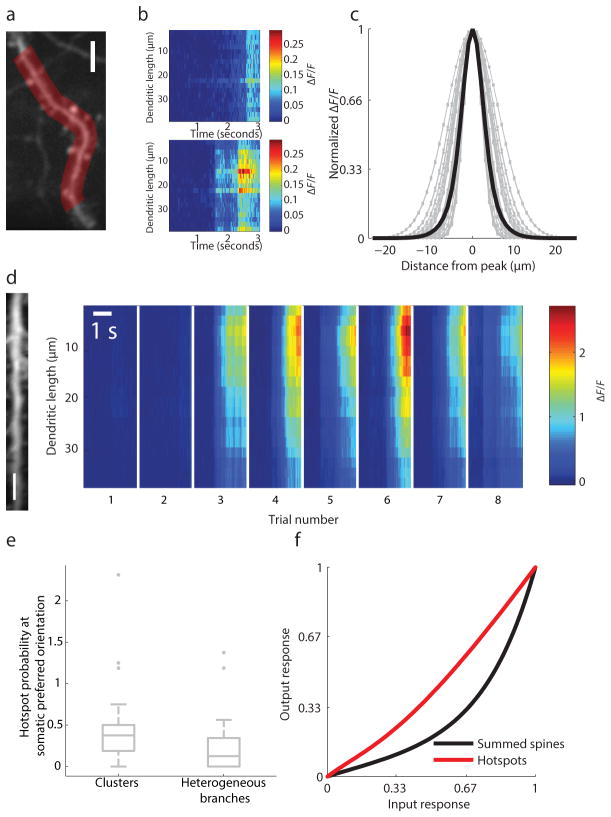
Functional clustering and dendritic hotspots. (a) example dendritic ROI, scale bar 5 μm; (b) examples of spatially uniform (top) and spatially restricted (bottom) dendritic calcium events; (c) spatial profile of local dendritic calcium events from a single cell; single traces are gray and average is black; (d) Example of reliable trial-to-trial dendritic hotspot (imaged dendrite, left, with 5 um scale bar) calcium responses, right); (e) Dendrites with clusters (circular dispersion <15°) are significantly more likely to evoke dendritic hotspots than those with more heterogeneous synaptic inputs (circular dispersion >30°); hotspot probability exceeds 1 in cases where we detected more than one hotspot on a given trial; (f) hotspots linearly predict somatic responses compared with summed spine inputs

