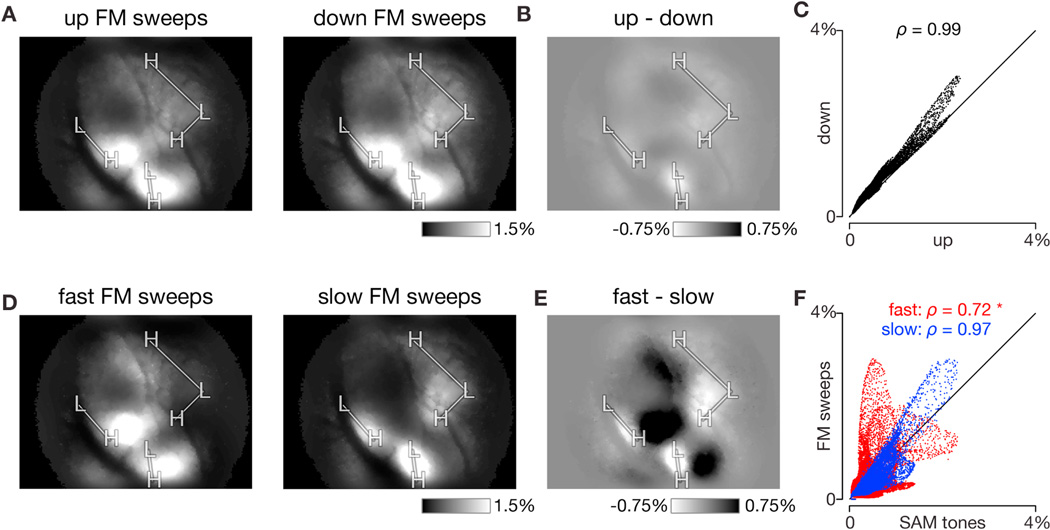
Figure 3. Dependence of FM sweep responses on direction and rate.
(A) Average response to upward FM sweeps (left) and downward FM sweeps (right). Each condition averaged over all 8 sweep rates used. Same experiment as shown in Figure 2. Equivalent ΔF/FO scale bar on lower right.
(B) Difference in response to up and down sweeps. Map generated by subtracting response to downward FM sweeps (right panel of A) from response to upward FM sweeps (left panel of A). Equivalent ΔF/FO scale bar on lower right.
(C) Scatter plot of downward FM sweep response strength versus upward FM sweep response strength for each pixel. Response strengths taken directly from panel A. Spearman correlation displayed at top of plot.
(D) Average response to fast FM sweeps (left, 360 and 670 oct/s) and slow FM sweeps (right, 8 and 16 oct/s). Data averaged across up and down sweeps at −40 dB attenuation. Equivalent ΔF/FO scale bar on lower right.
(E) Difference in response to fast and slow sweeps. Map generated by subtracting response to slow FM sweeps (left panel of D) from response to fast FM sweeps (right panel of D). Equivalent ΔF/FO scale bar on lower right.
(F) Scatter plot of fast (red) and slow (blue) FM sweep response strengths versus SAM tone response strength for each pixel. Response strengths taken directly from panel D. Spearman correlation for each comparison displayed at top of each plot. Asterisk indicates that only red scatterplot (fast FM sweep versus SAM tone response) was significantly different (outside a 95% confidence interval) from the null distribution, which was estimated by Spearman correlations between randomly sampled SAM tone responses.

