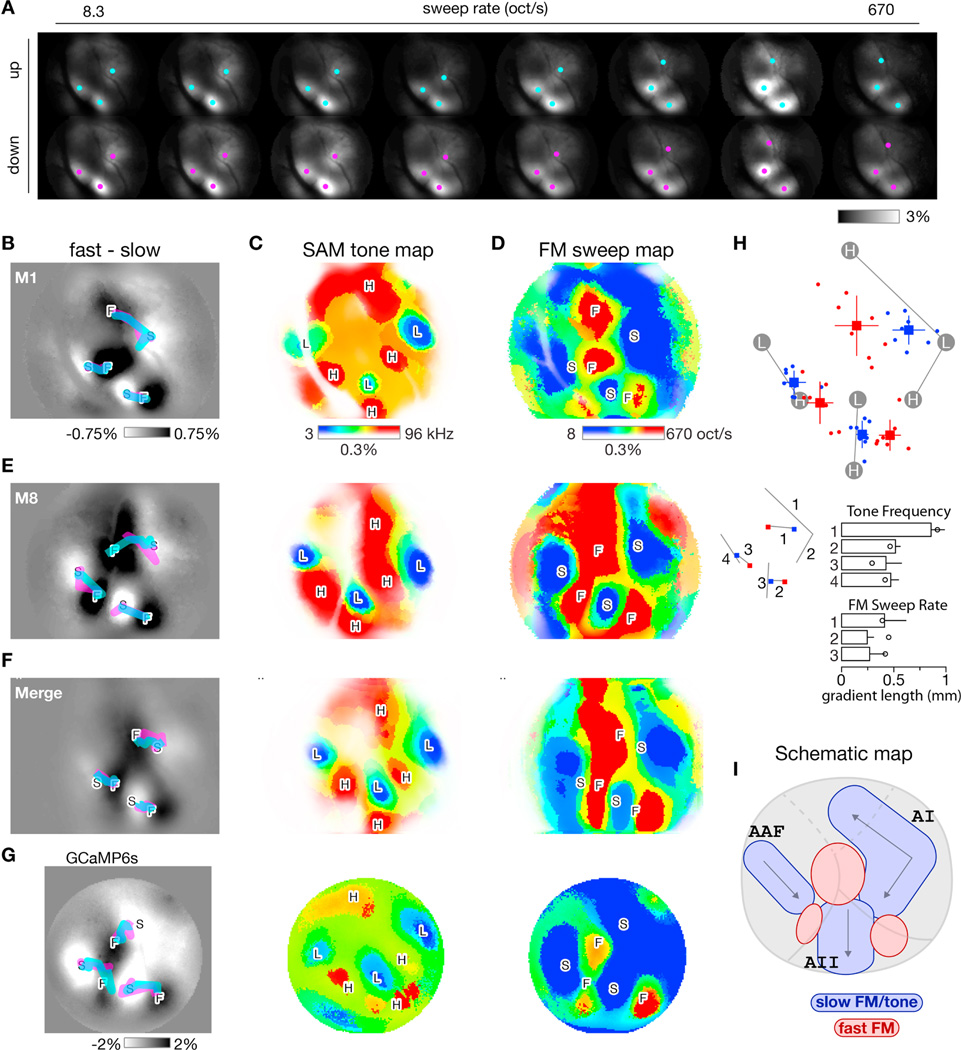
Figure 4. Formation of FM sweep maps and comparison across experiments.
(A) Transcranial fluorescence responses during presentation of FM sweeps of various sweep rates (columns) and directions (rows). Images displayed as in Figure 2F. Equivalent ΔF/FO scale bar on lower right. Same mouse as Figures 2 and 3 but now responses averaged over multiple sound levels. Cyan and magenta dots represent local center-of-mass of response peaks for up and down sweep responses, respectively.
(B) Difference in response between fast and slow FM sweeps, averaged over upward and downward sweeps for the 2 fastest (360 and 670 oct/s) and 2 slowest (8 and 16 oct/s) sweeps tested. Thick cyan and magenta lines, derived from center-of-masses marked in A, track peak of responses to up and down sweeps as sweep rate increases from slow (S) to fast (F) sweeps.
(C) Best-frequency map derived from responses to individual SAM tones. Best frequency at each pixel approximated as weighted average of 3 frequencies eliciting largest responses at threshold sound level. Color map (right) indicates best-frequency color assignments (blue = low, red = high) and response strength (color saturation corresponds to response amplitude).
(D) Best-rate map derived from responses to individual FM sweeps. Format analogous to C except now pixel color indicates preferred rate of FM sweep (blue = slow, red = fast).
(E) Maps for one other experiment. Same format as panels B-D.
(F) Average of 8 individual transcranial response maps, including those in panels B-E, demonstrating preservation of overall canonical layout across mice. Landmark-based registration was used to morph each individual map onto a common coordinate system before averaging. Registration for both SAM tone maps and FM sweep maps was based on tone-map landmarks, which are derived from responses to low (L) and high (H) frequency SAM tones. Gradients were computed from the merged response maps. See panel H for gradients computed from the individual trajectories.
(G) Maps for a transgenic GCaMP6s mouse with a chronic window. SAM tone frequency maps averaged over 16 trials. FM sweep rate maps averaged over 14 trials.
(H) Layout of response peaks for slow (8 oct/s, blue) and fast (670 oct/s, red) FM sweeps across 8 experiments. Experiments where registered onto a common coordinate system based on tone-map landmarks. Dots indicate individual experiments; squares and lines indicate means and standard deviations. Lengths of each of the seven gradients (four for SAM tone frequency and three for FM sweep rate) are shown in the bar plots along with standard deviations. Circles denote gradient lengths for GCaMP6s experiment shown in panel G.
(I) Schematic of slow-FM sweep / SAM tone (blue shapes) and fast-FM sweep (red shapes) regions as they intersect with traditional boundaries of AI, AAF, and AII.

