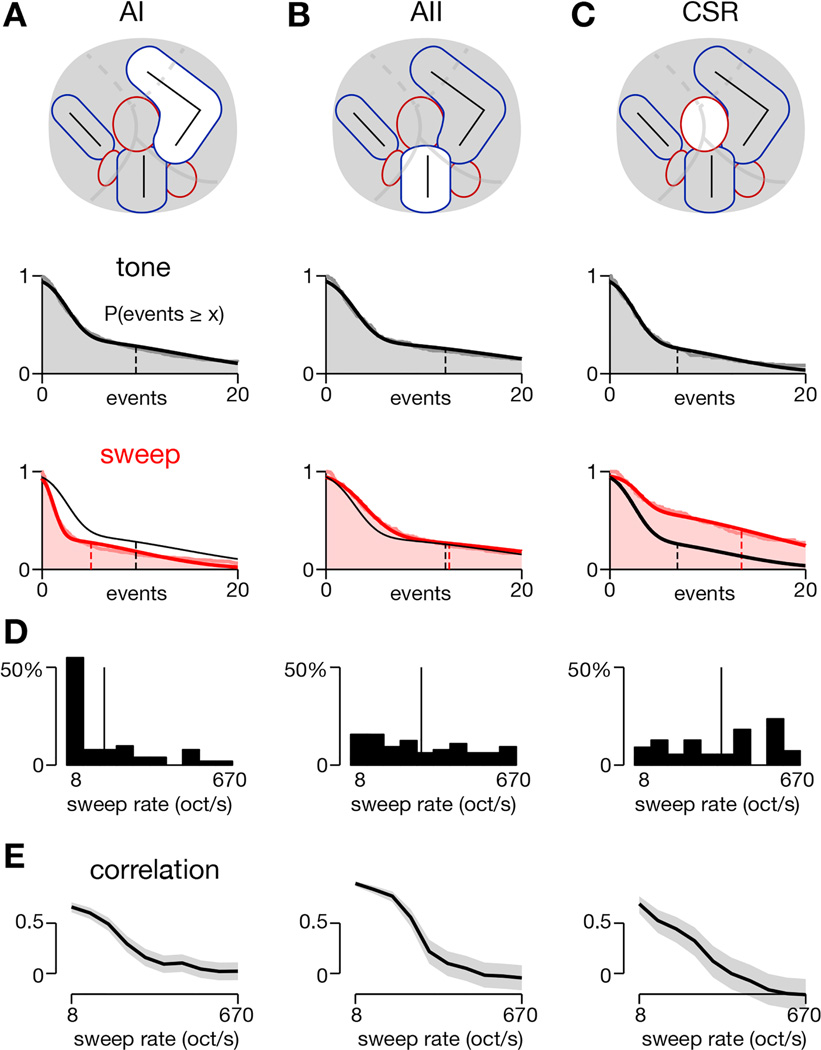
Figure 6. Differences in responses to tones and sweeps across three cortical regions.
Average responses to tones and sweeps of individual neurons registered to AI, AII, and CSR.
(A–C) Histograms demonstrating strength of responses to SAM tones and FM sweeps for neurons within each region. Schematized locations of these regions are shown in the top row. Histograms of tone responses are represented by gray shading with mean response indicated by dashed vertical line (middle row). Histograms of sweep responses are shown in red shading with mean response as dashed vertical red line and mean tone response shown again as dashed vertical black line (bottom row). AI: µtone = 9.6 (6.6), µsweep = 5.0 (2.9), p < 1e-26 (p < 1e-21); AII: µtone = 12.2 (10.0), µsweep = 12.6 (10.0), p = 0.047 (p = 0.6); CSR, µtone = 6.9 (4.2), µsweep = 13.5 (7.0), p < 1e-7 (p < 1e-4). Numbers in parentheses are for neuropil-subtracted data. Statistical tests via 2-sided Wilcoxon signed-rank test.
(D) Distribution of preferred sweep rate for neurons in each region. For FM sweep-responsive neurons, the preferred sweep rate was computed for each neuron and binned into one of the 10 sweep rates tested. Thin vertical line indicates the mean sweep rate for each population (19.67 for AI, 52.12 for AII, and 83.76 oct/s for CSR).
(E) Correlation between FM sweep response and SAM tone response as a function of FM sweep rate. Maximum response at each stimulus condition used for calculations. Gray shading indicates 95% confidence intervals.

