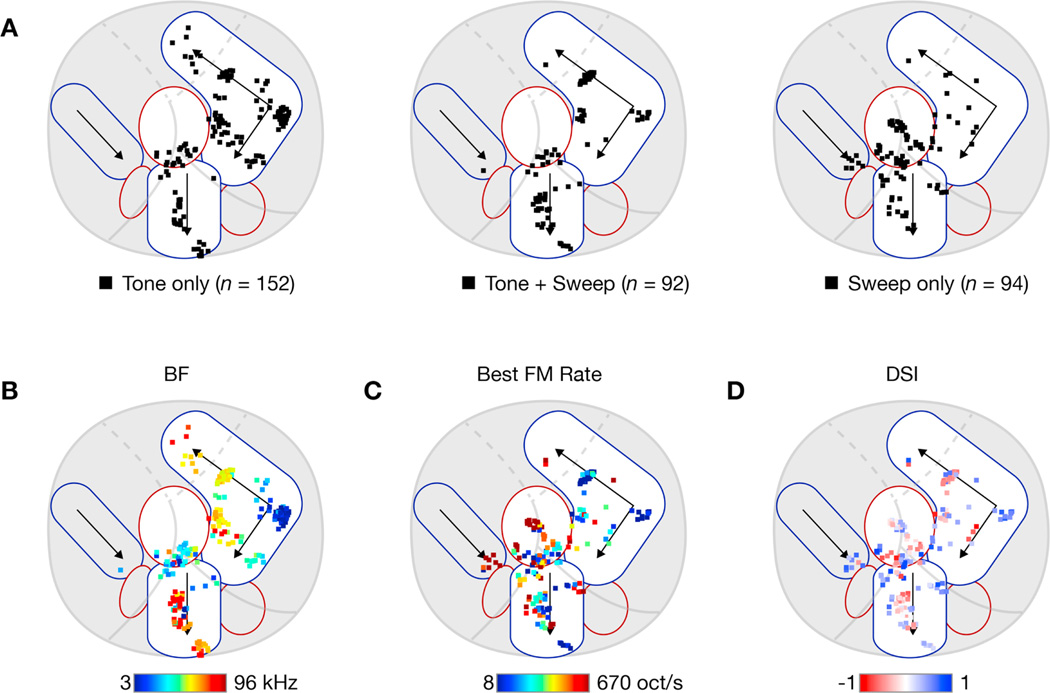
Figure 7. Distribution of tone and sweep neurons throughout auditory cortex.
Individual neurons across all experiments were registered onto a common coordinate system to visualize the population data.
(A) Categorization of responsive neurons into ‘Tone only’ (left), ‘Tone + Sweep’ (middle), and ‘Sweep only’ (right) based on presence of significant responses to each class of stimuli (see Methods for criteria used). Plots are overlaid on schematic representation of mouse auditory cortex with separate tone (blue-outlined shapes) and sweep (red-outlined shapes) regions.
(B) Best frequency map at the level of individual neurons. For all tone-responsive neurons, the best frequency is color-coded according to the colorbar below.
(C) Best sweep-rate map. For all sweep-responsive neurons, the preferred FM sweep rate is color-coded according to the colorbar below.
(D) Direction selectivity map. For all sweep-responsive neurons, the DSI is color-coded according to the colorbar below. Saturation indicates DSI magnitude, with full saturation corresponding to a DSI of +1 or −1.

