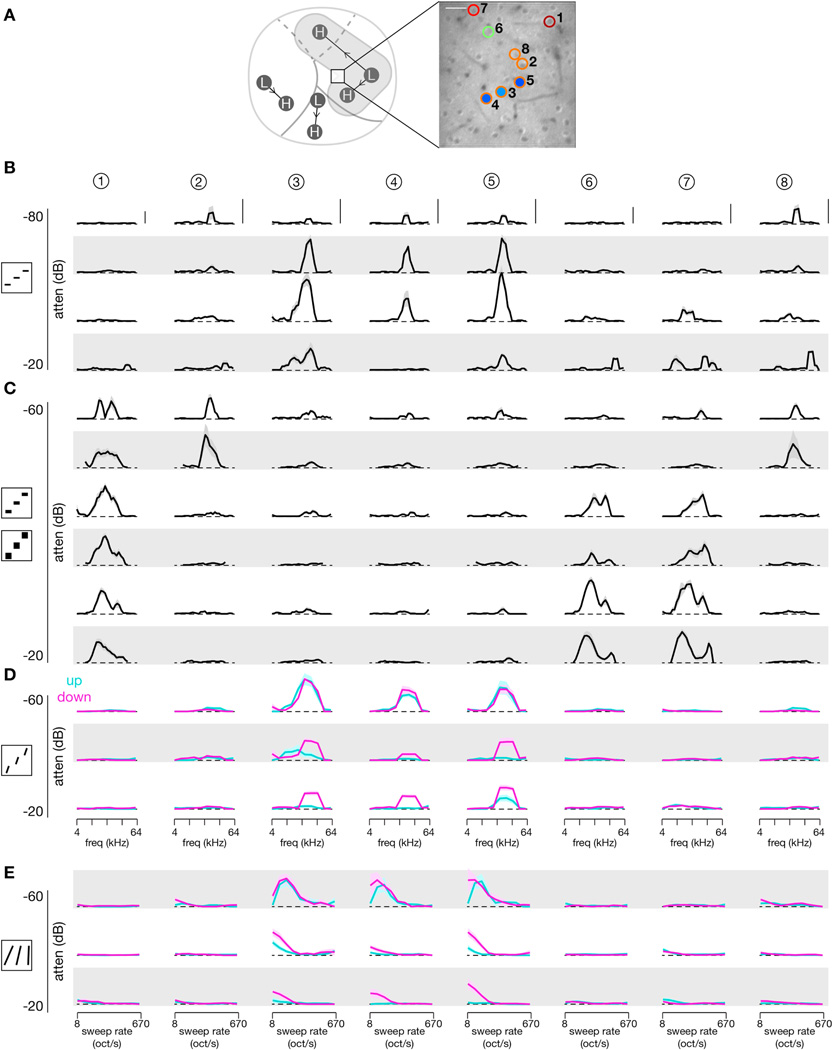
Figure 9. Tuning curves across stimuli for a local population of individual neurons.
Comprehensive responses across a large array of stimuli for 8 neurons from a single two-photon imaging field. Means shown as dark trace and ± SEM as shaded region. For PWS and FM sweeps, responses to upward sweeps are shown in cyan and responses to downward sweeps in magenta. Scale bar: 10% ΔF/FO.
(A) Location of two-photon imaging field (left) and individual neurons (right).
(B) SAM tone tuning curves across four different sound levels.
(C) BLN tuning across three different sound levels and two different octave ranges. Top two rows show responses to 0.25-octave BLN stimuli (top) and 1-octave BLN stimuli (second row) at −60 dB attenuation. Next two rows show responses to 0.25-octave and 1-octave BLN stimuli at −40 dB attenuation, and final two rows show responses at −20 dB attenuation.
(D) PWS tuning across three different sound levels. Each stimulus swept at 10 oct/s for 0.5 s, resulting in a frequency span of 0.5 octaves. Ten different center frequencies and two different directions (up and down) were used.
(E) FM sweep tuning across three different sound levels. Each stimulus swept from 3 to 96 kHz with sweep rate and direction varied.

