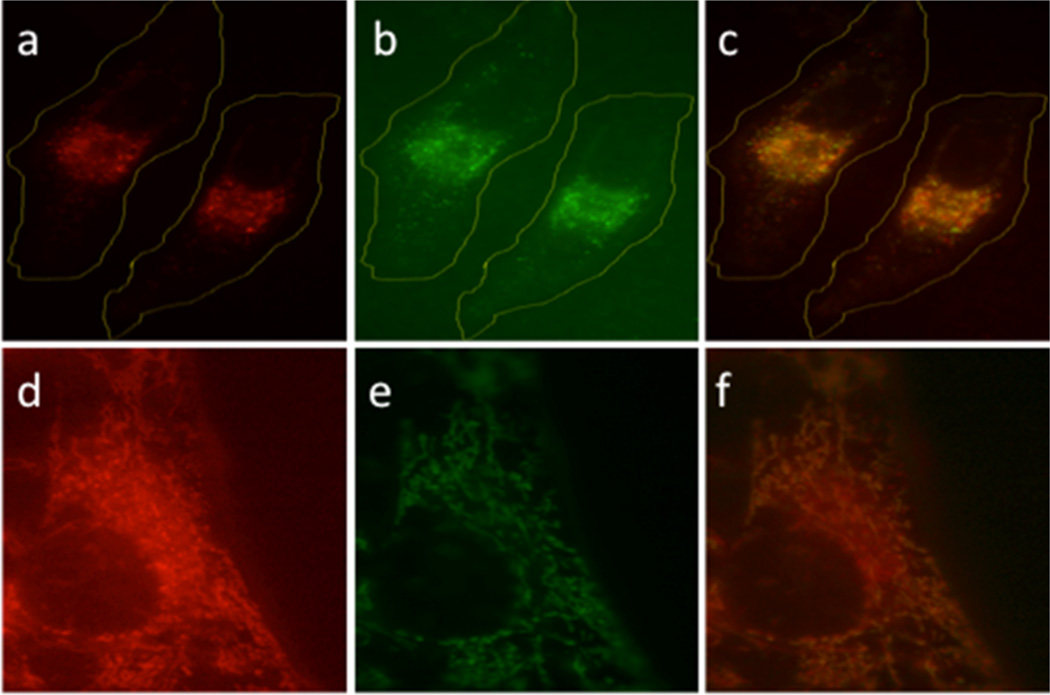
Figure 2.
Light-induced (650 nm) translocation of BODIPY 650 in HeLa cells.43 (a) BODIPY–Cbl, 7, before photolysis. (b) Endosome visualization as revealed by an endosomal marker. (c) Overlay of panels a and b. (d) BODIPY–Cbl after photolysis. (e) Mitochondrial visualization as revealed by a mitochondria marker. (f) Overlay of panels d and e. Reproduced with permission from ref 43. Copyright 2014 John Wiley & Sons, Inc.

