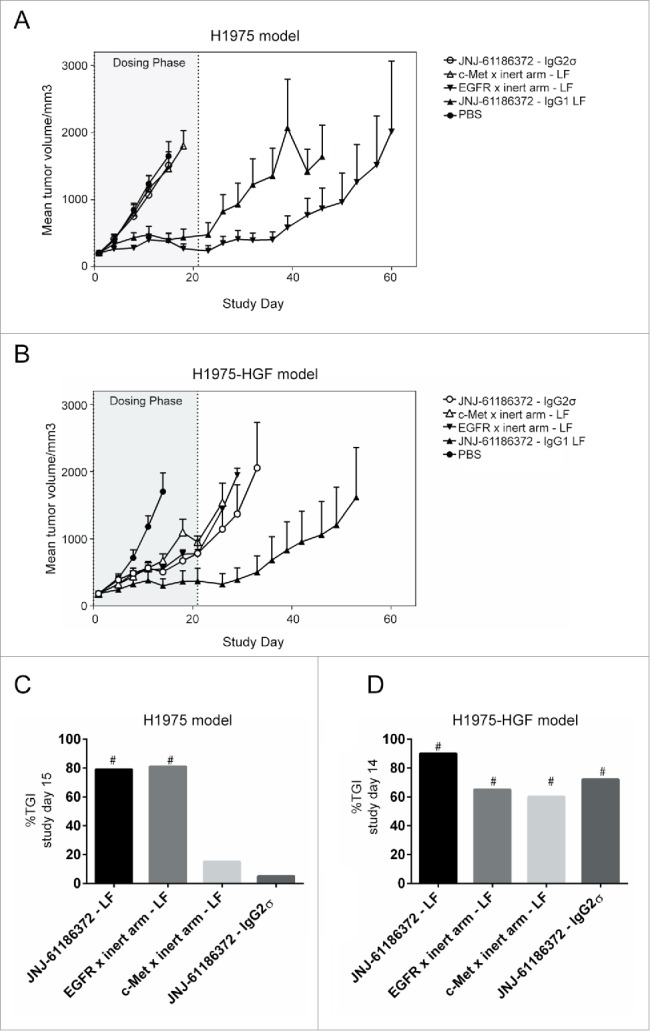
Figure 4.

Superior xenograft tumor growth inhibition by JNJ-61186372 produced in low fucose cell line. Female nude mice (n = 8/group) bearing subcutaneous H1975 (A) or H1975-HGF (B) tumors were treated with 10 mg/kg JNJ-61186372 – LF (closed up triangle), EGFR x inert arm – LF (closed down triangle), c-Met x inert arm – LF (open up triangle), JNJ-61186372 – IgG2σ (open circle) or PBS (closed circle) for 21 d (gray shaded dosing phase). Tumor growth was monitored twice weekly until reaching 2000 mm3. Bar graph comparing percent tumor growth inhibition (%TGI) on the day of the final measurement for the PBS control group was compared across all treatments in H1975 (C) and H1975-HGF (D) in vivo study. # indicate multiplicity adjusted Tukey-Kramer p values of ≤ 0.05. The PBS and JNJ-61186372 tumor growth curves in this figure were previously displayed in Moores, et al.18
