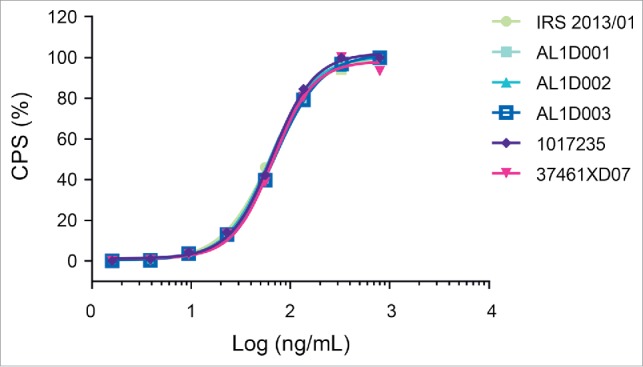
Figure 5.

Inhibition of TNF-induced cytotoxicity. Representative graphs with an overlay of full-dose response curves (CPS: count-per-second) from one MSB11022 internal reference standard (IRS 2013/01), 3 batches of MSB11022 (AL1D001, AL1D002, and AL1D003) and 2 batches of Humira® (1017235 and 37461XD07).
