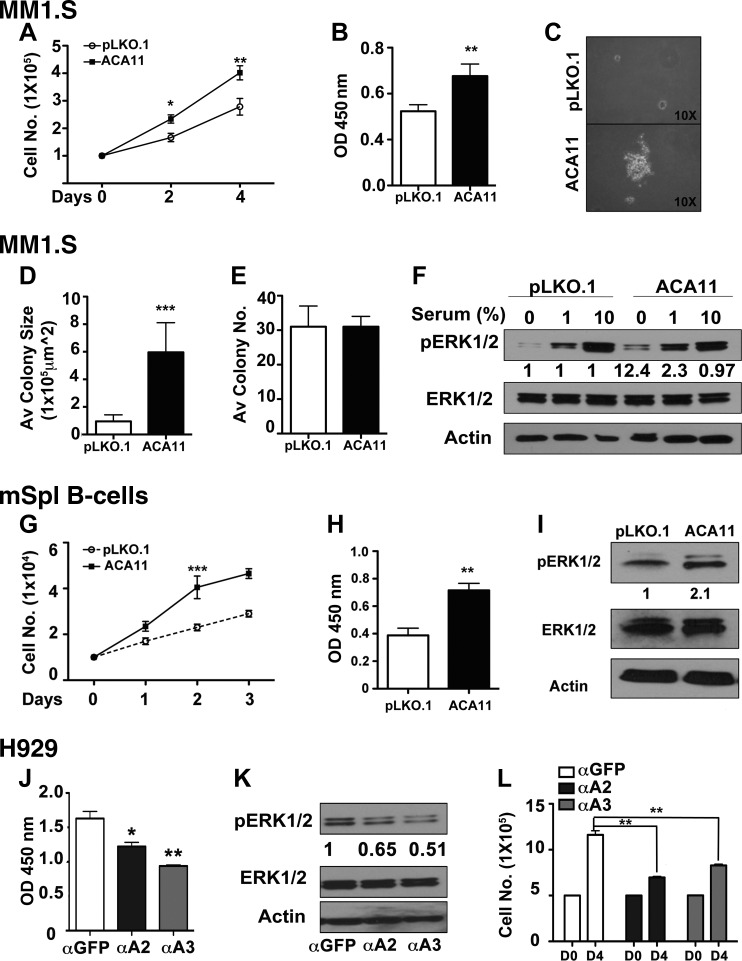
Figure 1.
ACA11 overexpression increases cell proliferation and activates ERK1/2. A) ACA11 increases proliferation of MM (MM1S) cells by cell-counting assay. B) Comparison of cellular proliferation pattern as determined by BrdU assay. C) Representative images of soft agar colony-forming assay. D, E) Average (Av) colony size is significantly increased by ACA11 (D), while total colony number (no.) is not changed (E). F) Comparison of pERK1/2 activation in vector (pLKO.1)- and ACA11-overexpressing cells when cultured in presence of reduced serum concentrations. Fold increases are indicated compared to pLKO.1 controls by densitometry of respective bands. Actin is shown as loading control for total ERK levels. G) Cell counts of primary murine B cells overexpressing ACA11 or control retrovirus (pLKO.1). H) Increased cellular proliferation as determined by BrdU incorporation. I) Comparison of pERK1/2 levels in vector (pLKO.1)- and ACA11-overexpressing primary murine B cells. J) Knockdown of ACA11 in H929 MM cells by antisense oligonucleotides (αA2, αA3) reduces BRDU incorporation [α green fluorescent protein (αGFP), antisense oligonucleotide to GFP]. K) Antisense knockdown of ACA11 (αA2, αA3) reduces pERK1/2 levels in H929 cells grown in 1% serum. Fold decreases indicated compared to αGFP control. Actin is shown as loading control for total ERK levels. L) Cell proliferation is also inhibited by ACA11 knockdown in ACA11-overexpressing H929 cells. All data points represent means ± sd (n = 3). Representative figures are shown of experiments completed at least 3 times in triplicate. Asterisks indicate significance according to Student’s t test (2-tailed) or 1-way ANOVA with Bonferroni posttest as required. *P < 0.05, **P < 0.01, ***P < 0.001 compared to respective control cells.

