Figure 2.
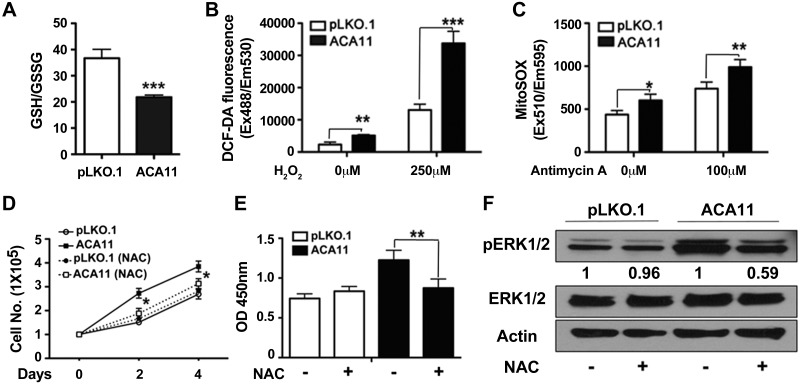
Proliferation induced by ACA11 is mediated by increased levels of ROS. A) Ratio of reduced GSH to oxidized GSSG. ACA11 overexpression reduces GSH/GSSG ratio, indicating increased oxidative stress. B) Total intracellular level of ROS at basal state and in response to H2O2 (250 μM) for 1 h were measured by using carboxy-DCFH-DA as fluorogenic substrate in MM1.S cells. C) Levels of mitochondrial superoxide at basal state and in response to antimycin (100 μM) for 1 h were measured by using MitoSOX fluorogenic substrate in MM1.S cells. D, E) Treatment with antioxidant NAC significantly decreased proliferation of ACA11 cells, as determined by cell-counting assay (D) BrdU incorporation (E). F) Comparison of pERK1/2 levels in vector (pLKO.1)- and ACA11-overexpressing MM1.S cells cultured in 1% serum in absence and presence of NAC (1 mM) for 24 h. Actin is shown as loading control for total ERK levels. Representative Western blots are shown. All data points represent means ± sd (n = 3). Representative figures are shown of experiments completed at least 3 times in triplicate. Asterisks indicate significance according to Student’s t test (2-tailed) or 1-way ANOVA with Bonferroni posttest as required. *P < 0.05, **P < 0.01, ***P < 0.001 compared to respective control cells.

