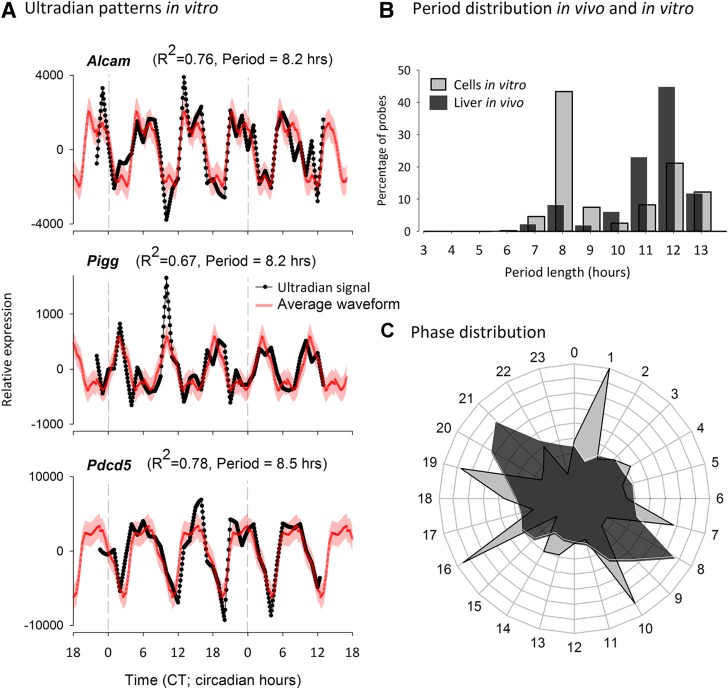
Figure 3.
A) Examples of ultradian residuals (black) and average ultradian waveform (red) for 3 probes classified as exhibiting ultradian expression patterns in NIH-3T3 cells in vitro. B) Comparison of the period distributions of ultradian rhythms in vivo and in vitro demonstrates that the largest group of in vitro ultradian rhythms oscillate with a period close to 8–9 h, whereas the largest group of ultradian rhythms in vivo exhibit a period close to 12–13 h. C) The difference in the period distribution between in vivo and in vitro ultradian rhythms is also reflected by the clustering of ultradian peak phases, which exhibit more clusters in vitro than in vivo.

