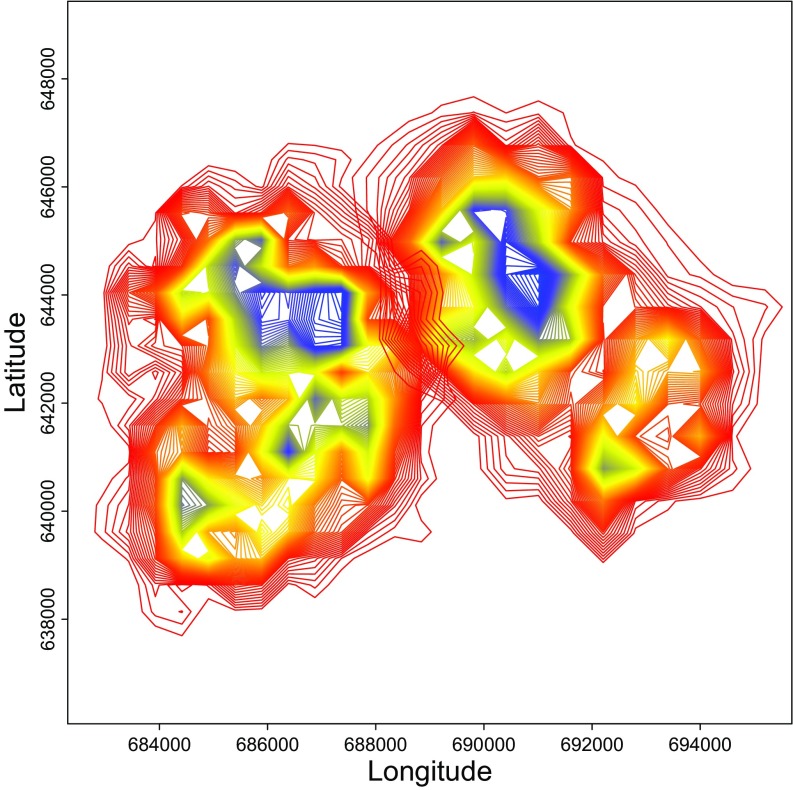
Fig. S4.
Kernel density estimate constructing polygons representing the percentage of home-range use in South (west of longitude 688500) and East (east of longitude 688500) groups. The polygons range from 5 to 99, with 5 (blue) representing the very core of the home range and 99 (red) being the border areas.

