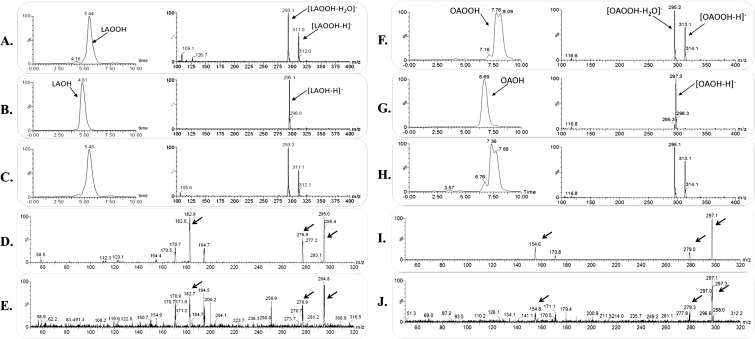
Fig. S3.
Mass spectrometry analysis of the products formed in the XfOhr reaction with LAOOH and OAOOH. (A–C) Chromatographic profile (Left) and mass spectrum (Right) of LAOOH. (A) Control, LAOOH in the absence of XfOhr. (B) Product of the reaction between XfOhr and LAOOH. (C) Product of the reaction between LAOOH and XfOhr previously alkylated with NEM. (D and E) Tandem mass spectometry (MS/MS) spectrum of the authentic linoleic acid hydroxide standard (fragment ions of m/z = 295) and for the ions formed in the Ohr reaction, respectively. (F–H) Chromatographic profile (Left) and mass spectrum (Right) of OAOOH. (F) Control reaction: OAOOH in the absence of XfOhr. (G) Product of the reaction between XfOhr and OAOOH. (H) Product of the reaction between OAOOH and XfOhr previously alkylated with NEM. (I and J) MS/MS spectrum of the authentic oleic acid hydroxide standard (fragment ions of m/z = 297) and for the ions formed in the XfOhr reaction, respectively. Arrows show similar peaks in both samples.

