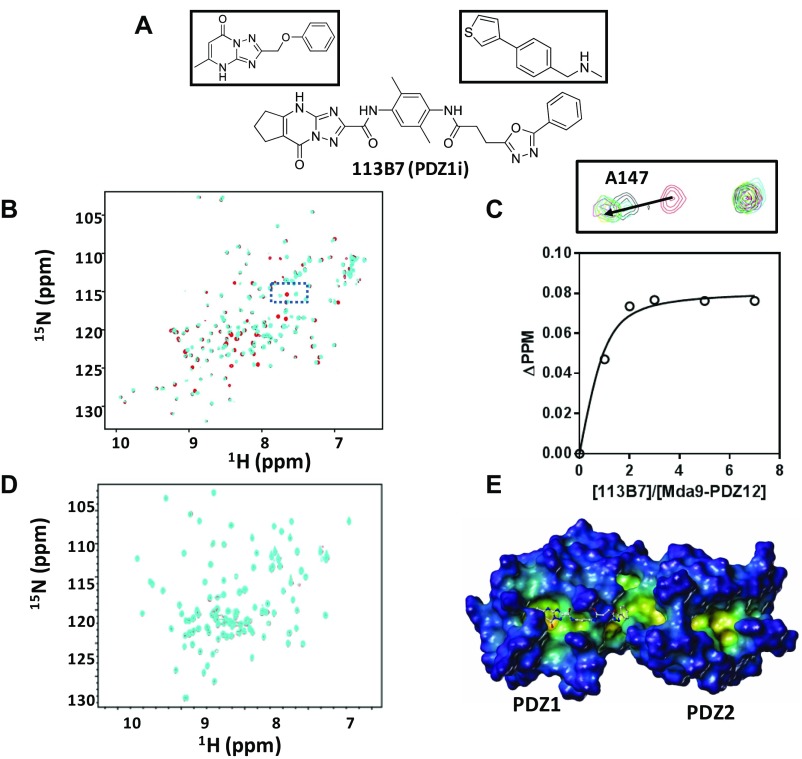
Fig. S1.
(A) Chemical structures of the two initial fragment hits (Top) and the structure of the resulting bidentate molecule 113B7 (PDZ1i). (B) Superposition of 2D [15N,1H] HSQC spectra of 50 µM MDA-9 PDZ1/2 tandem domain in the absence (red) and presence of 350 µM 113B7 (cyan). (C) Binding curve and representative spectra for the titration of 113B7 against the MDA-9 PDZ1/2 tandem domain. (C, Top) Zoom of the boxed region in B after titrating 113B7 into the MDA-9 PDZ tandem domain. The cross-peak corresponding to the backbone amide of residue A147 experiences a gradual shift upon the addition of 113B7 (red, 0 µM; black, 50 µM; green, 100 µM; orange, 150 µM; magenta, 250 µM; cyan, 350 µM). (C, Bottom) Titration curve of 113B7 for residue A147. The dissociation constant for the binding of 113B7 to MDA-9 was calculated to be 21.37 ± 8.62 µM. (D) Superposition of 2D [15N,1H] HSQC spectra of 50 µM PDZ domain from X11/mint scaffold protein (20 mM; 33% identity with PDZ1) is shown in the absence (cyan) and presence of 100 mM 113B7 (red). No appreciable binding is detected. (E) Docked structure of 113B7 in complex with the MDA-9 PDZ tandem domain (Protein Data Bank ID code 1W9E). The pose was obtained with GOLD (Cambridge Crystallographic Data Centre). Two PDZ domains of MDA-9 are labeled. The surface of the MDA-9 PDZ tandem domain is displayed and color-coded according to cavity depth: blue, shallow; yellow, deep (MOLCAD) (SYBYL-X, Certara USA, Inc.). The structure of 113B7 is displayed as balls and sticks.

