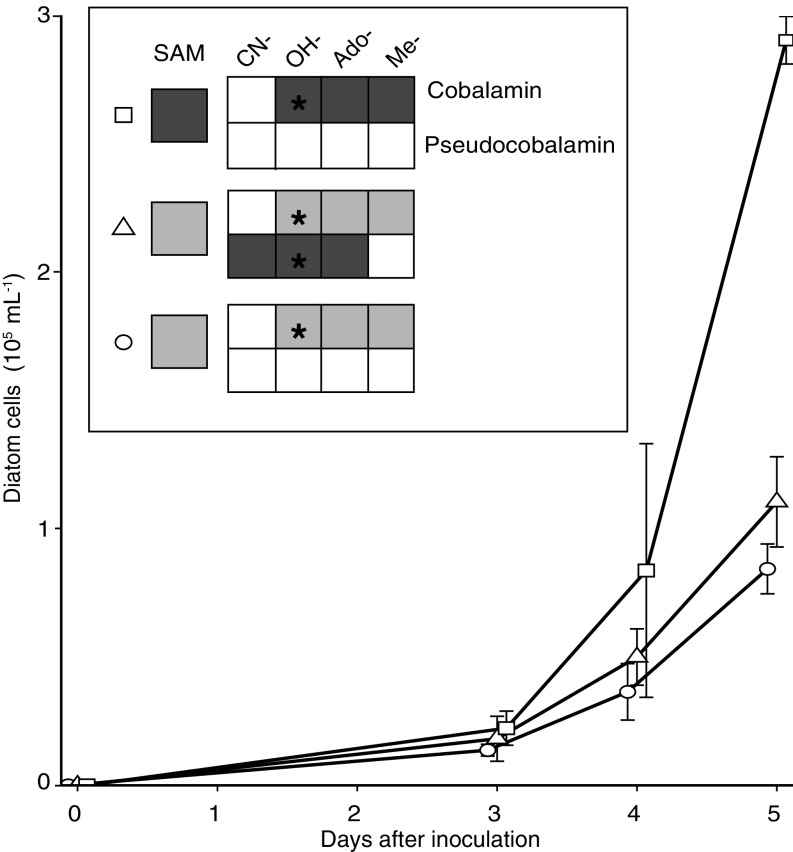
Fig. 4.
Growth of the diatom T. pseudonana with pseudocobalamin. (A) Growth of diatoms under Control (1 pM cobalamin, circle), +Pseudocobalamin (1 pM cobalamin with 200 pM pseudocobalamin, triangle), and +Cobalamin (200 pM cobalamin, square) treatments over time; error bars, SD from three replicates. Inset shows the final SAM, cobalamin, and pseudocobalamin cellular contents compared with Control treatment on a per cell basis: not detected (white), similar range to control (light gray), or statistically higher than control (Student’s unpaired t test, P < 0.05, dark gray). Black stars indicate what forms of cobalamin or pseudocobalamin were added to each treatment. See Fig. S5 for absolute values of cobalamins and SAM.

