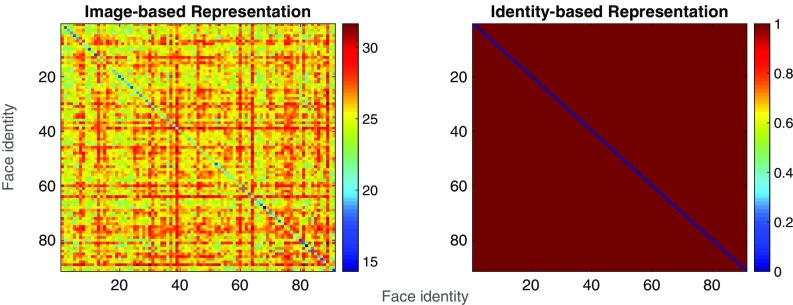
Fig. 2.
Heat maps showing pairwise distance values for “image-based” and “identity-based” representations of the facial identities in our stimulus set. Each cell of each matrix shows the distance value associated with the comparison of two identities, across a change in facial expression, with hotter colors indicating a greater distance (i.e., larger difference between the representations of each identity in the pair).

