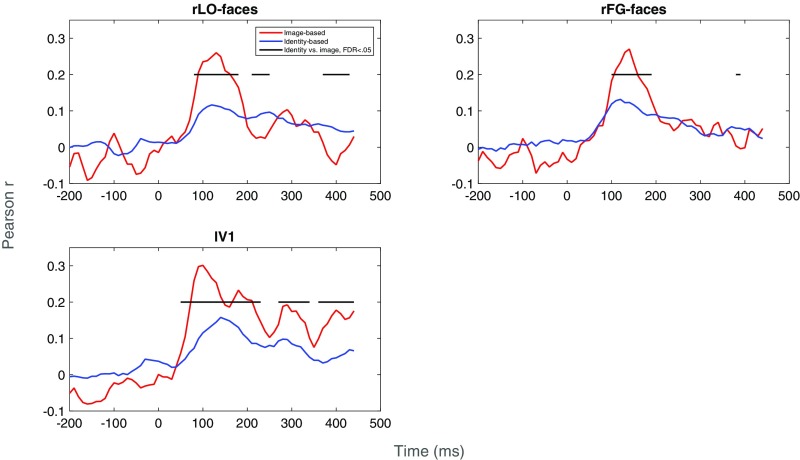
Fig. 5.
Correlations between neural data and image-based and identity-based representations of our stimuli, as a function of time (milliseconds). Separate plots are given for each region of interest (rLO-faces, rFG-faces, lV1). The horizontal black line indicates postbaseline time points at which correlations differed significantly [false discovery rate (FDR) < 0.05] between the two types of representations.

