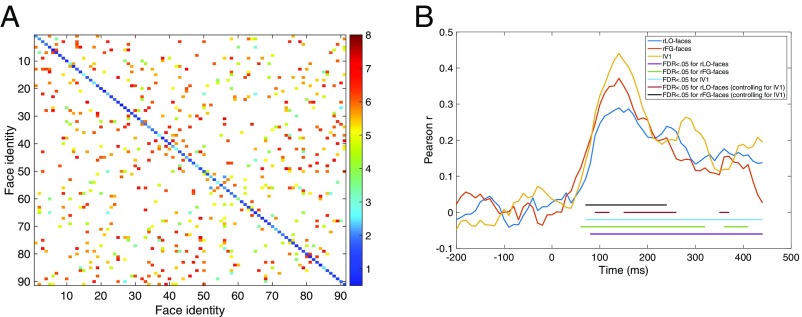
Fig. 6.
(A) Heat map showing mean (across seven participants) pairwise cross-expression behavioral dissimilarity ratings for a subset of face pairs presented during the MEG experiment. Hotter colors indicate greater dissimilarity. Face pairs presented during the MEG experiment but not during the behavioral experiment are shown in white. (B) Correlations between behavioral and neural data, as a function of time (milliseconds). Horizontal lines indicate postbaseline time points at which correlations were statistically significant (FDR < 0.05) and those at which face-selective regions predicted behavioral responses after controlling for responses in the control region (FDR < 0.05).

