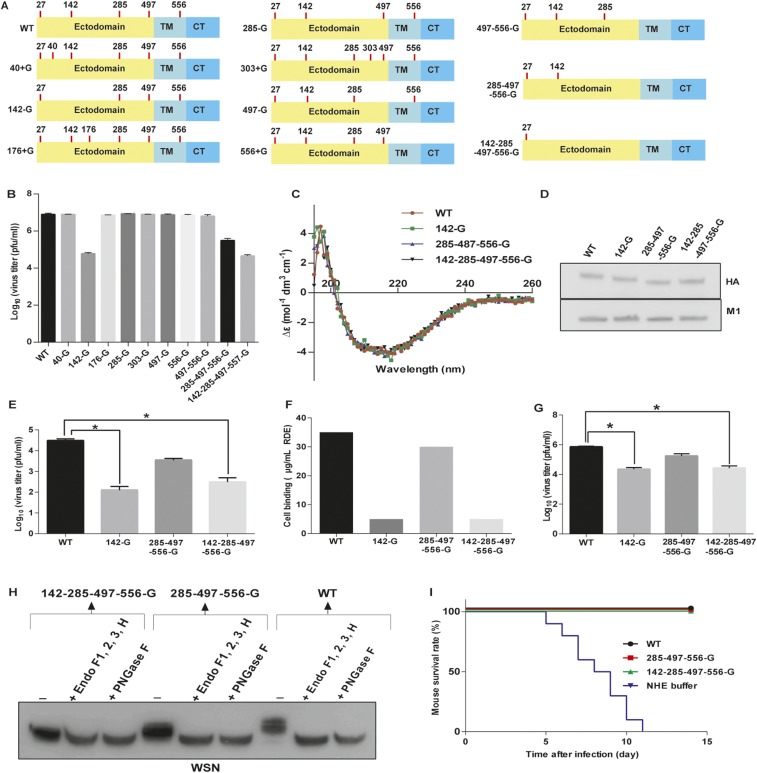
Fig. S1.
HA glycosylation and IAV. (A) Schematic overviews of 11 IAVs with different glycosites on HA highlighted with red lines; C, C-terminal cytoplasmic domain; TM, transmembrane domain. All recombinant viruses were confirmed by genome sequencing. (B) Comparison of virus production in A549 cells infected with 11 variants of virus at 48 hpi. (C) Circular dichroism spectra of HA variants as indicated. (D) Western blot analysis of four variants of IAV at the same amount. The filter was probed with anti-HA and anti-M1 monoclonal antibodies. (E) The infectivity of viruses with changes of HA glycosylation. MDCK cells were infected with the same amount of viruses as indicated in the figure and then the virus titer was determined by plaque assay. (F) Cell receptor binding avidities were determined by agglutination of turkey erythrocytes pretreated with RDE. The maximal amount of RDE that allowed full agglutination was measured. (G) Comparison of virus production in avian cells. Virus titers were determined from avian cells (LMH cells) infected with four variants of viruses as indicated at 48 hpi. (H) Western blot analysis of three variants of IAV after deglycosylation by the endoglycosidase mixture. The filter was probed with anti-HA antibody. (I) Following Fig. 1H, the mouse survival rate was measured after challenge with a lethal dose of WSN viruses. (B, E, F, and G) Mean ± SEM of three independent experiments. (I) Ten independent experiments are shown. *P < 0.001.

